DIY Cartography, Spring 2016
This graduate level seminar uses techniques of mapping—analyzing and making meaning of raw data—as a comparative analytic tool and as a way to uncover hidden meanings between data and reality. Connected to an ongoing project in partnership with the Urban Design Center and the City of Raleigh (COR) Museum, this course will analyze, synthesize and visualize Raleigh’s history, engage in field research as comparative analysis, and investigate and reflect on the effect of the mapping process on how data is understood. Through intense observation and interaction with census data, the physical environment and the offical and unofficial archival history of Raleigh, students will engage in a rich and triangulated approach to historical and social research. They will use the tools of mapping and synthesis as a way to make meaning of their findings and explain it to the community itself.
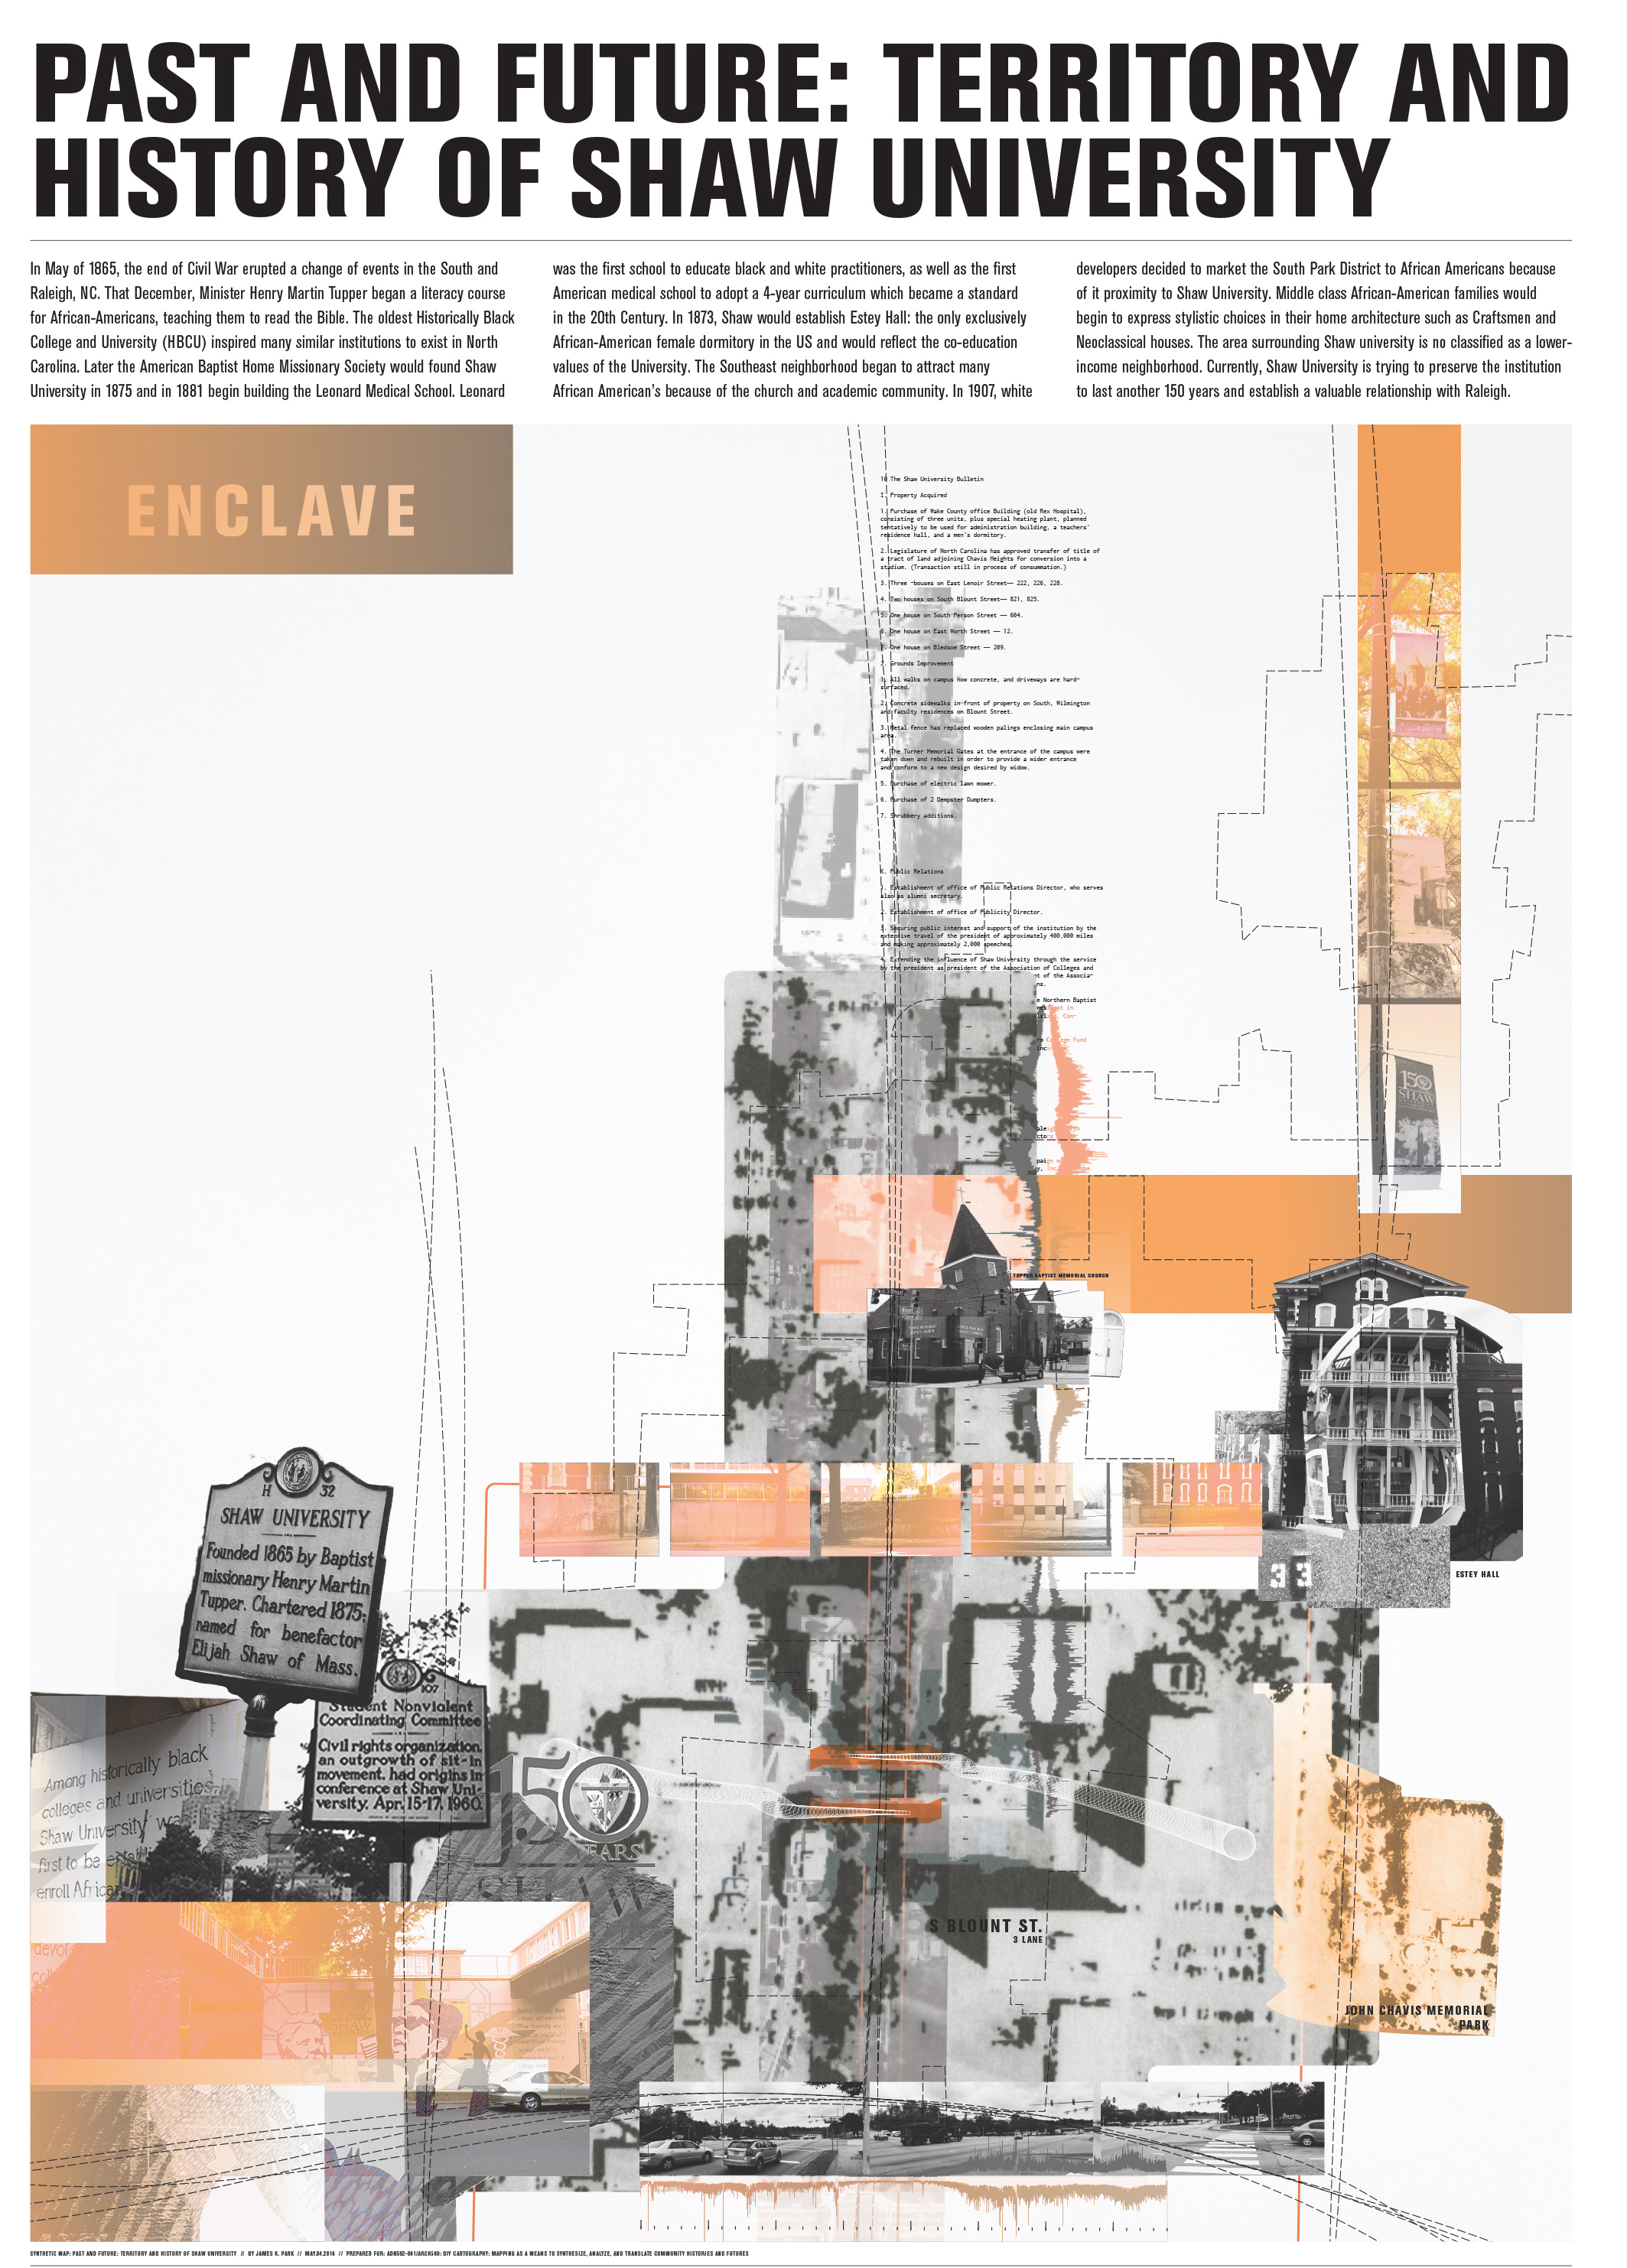
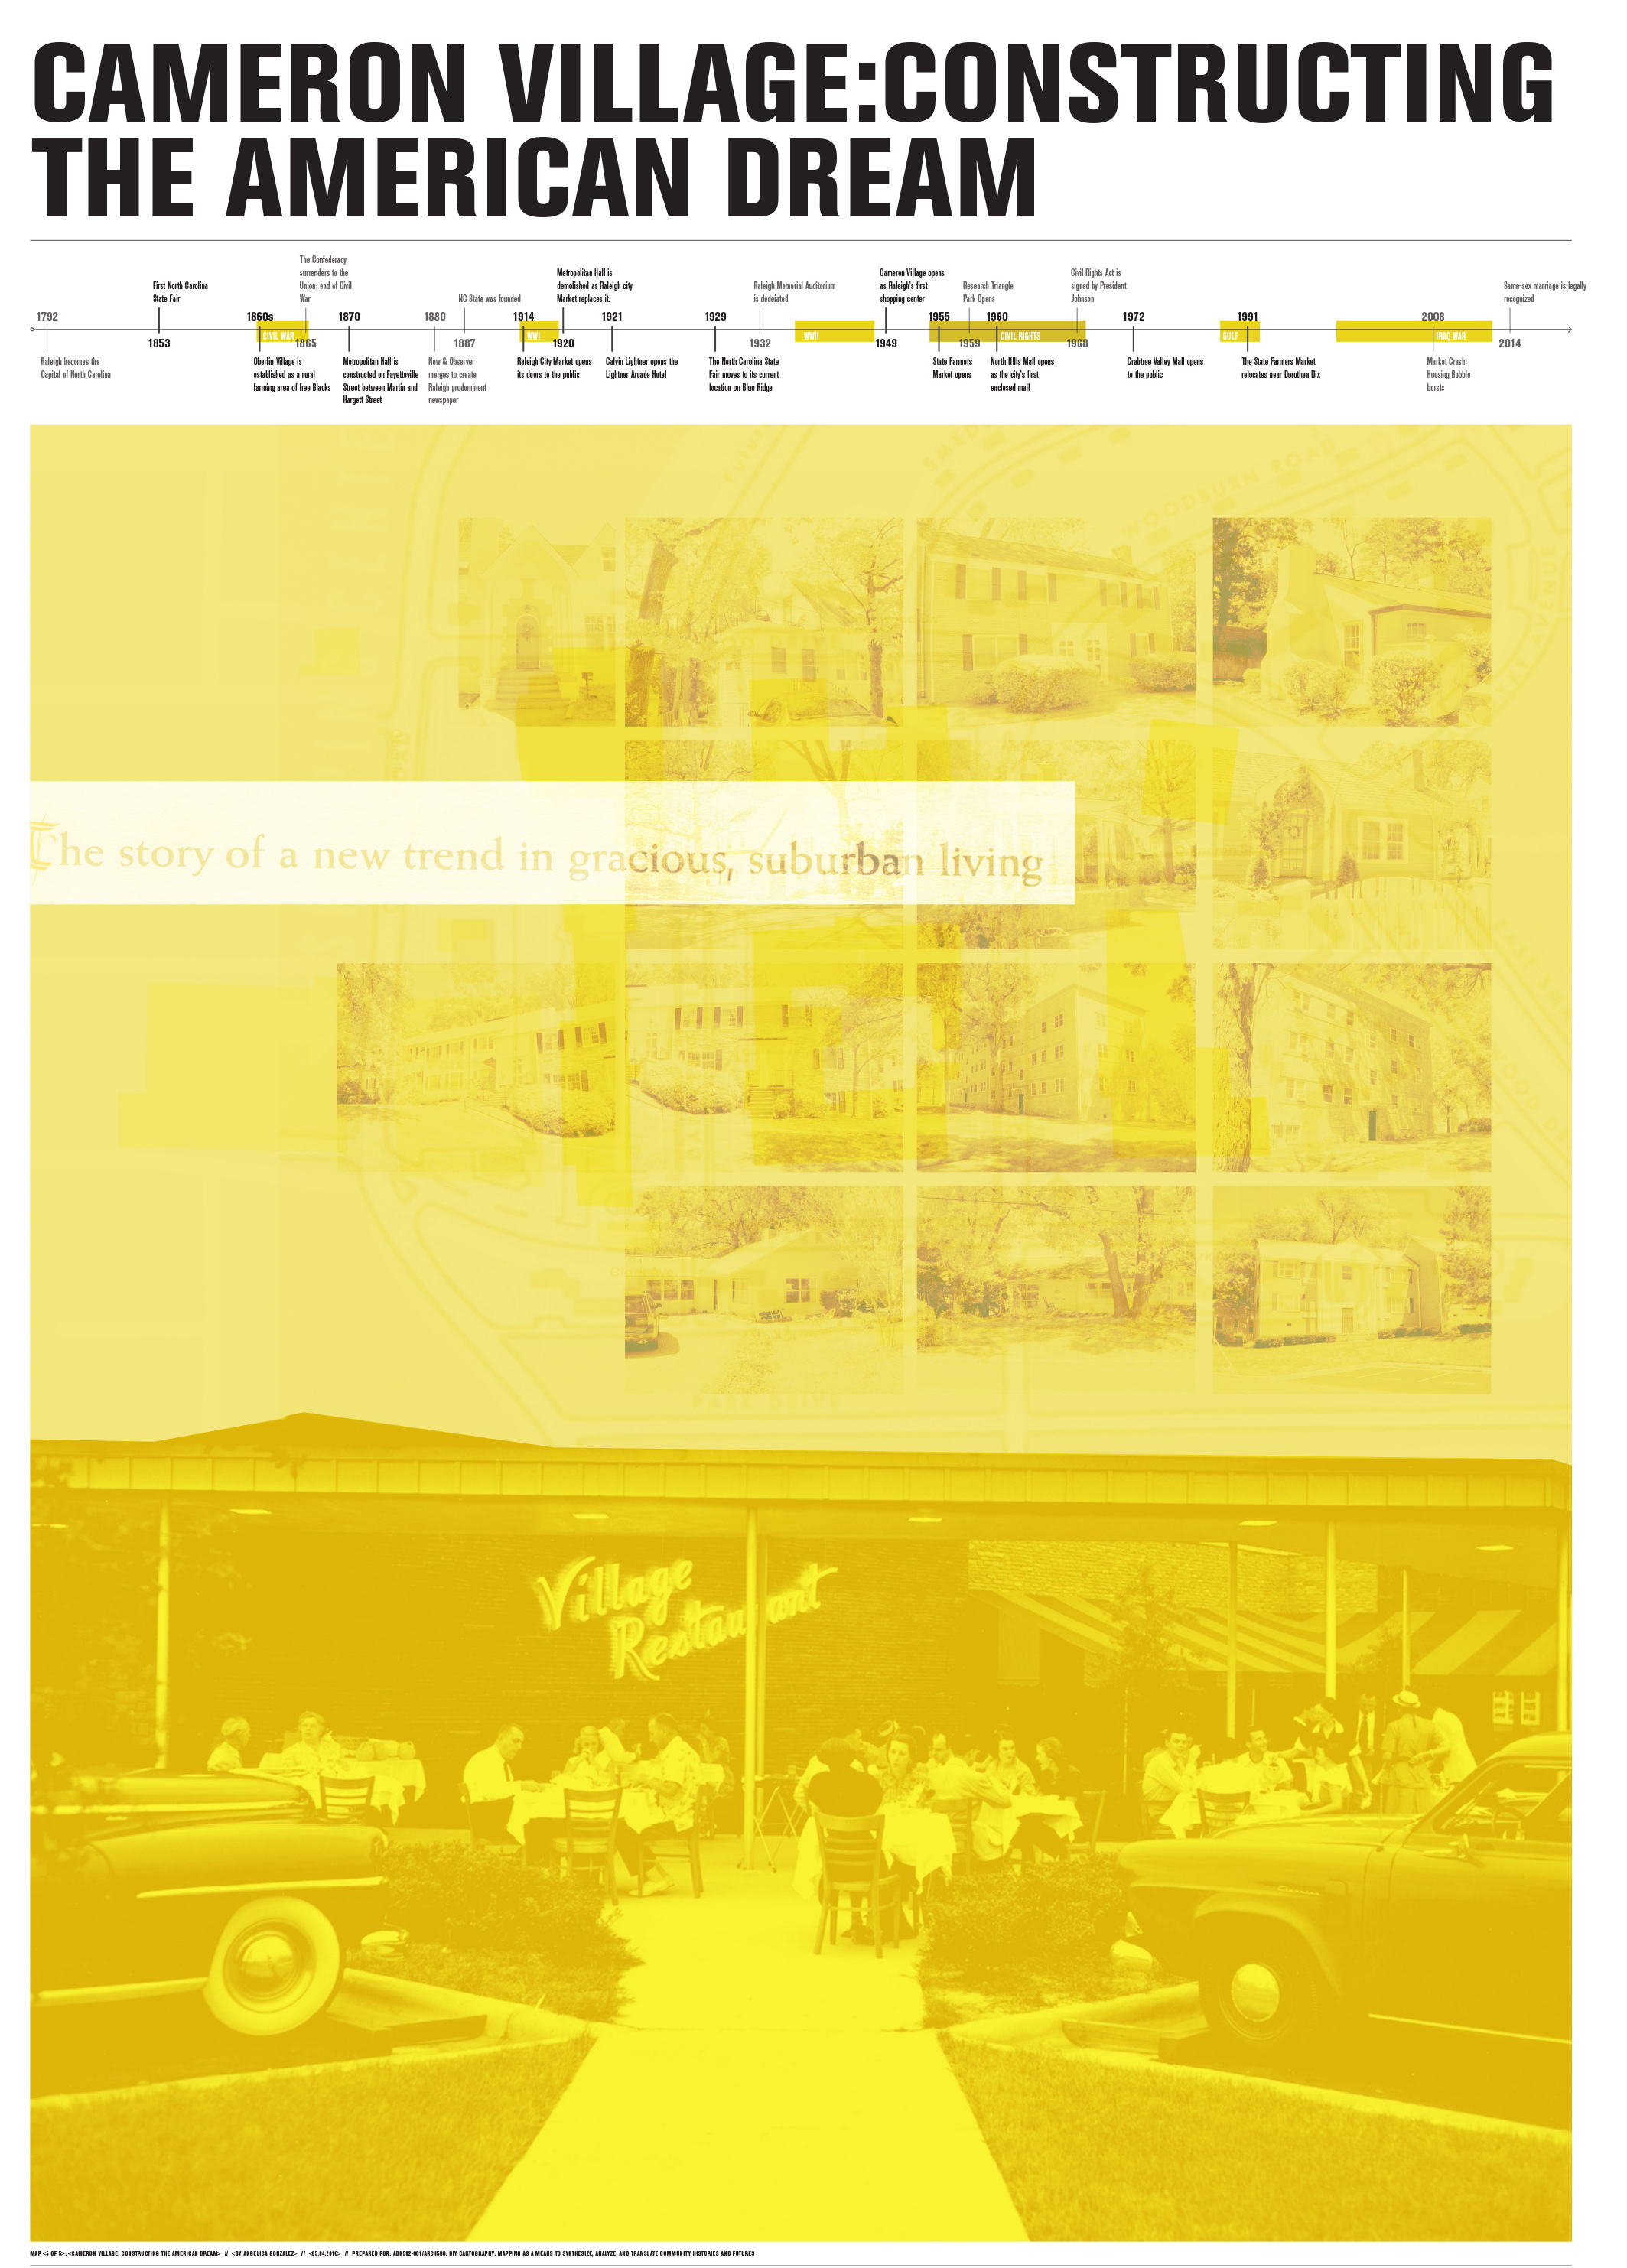
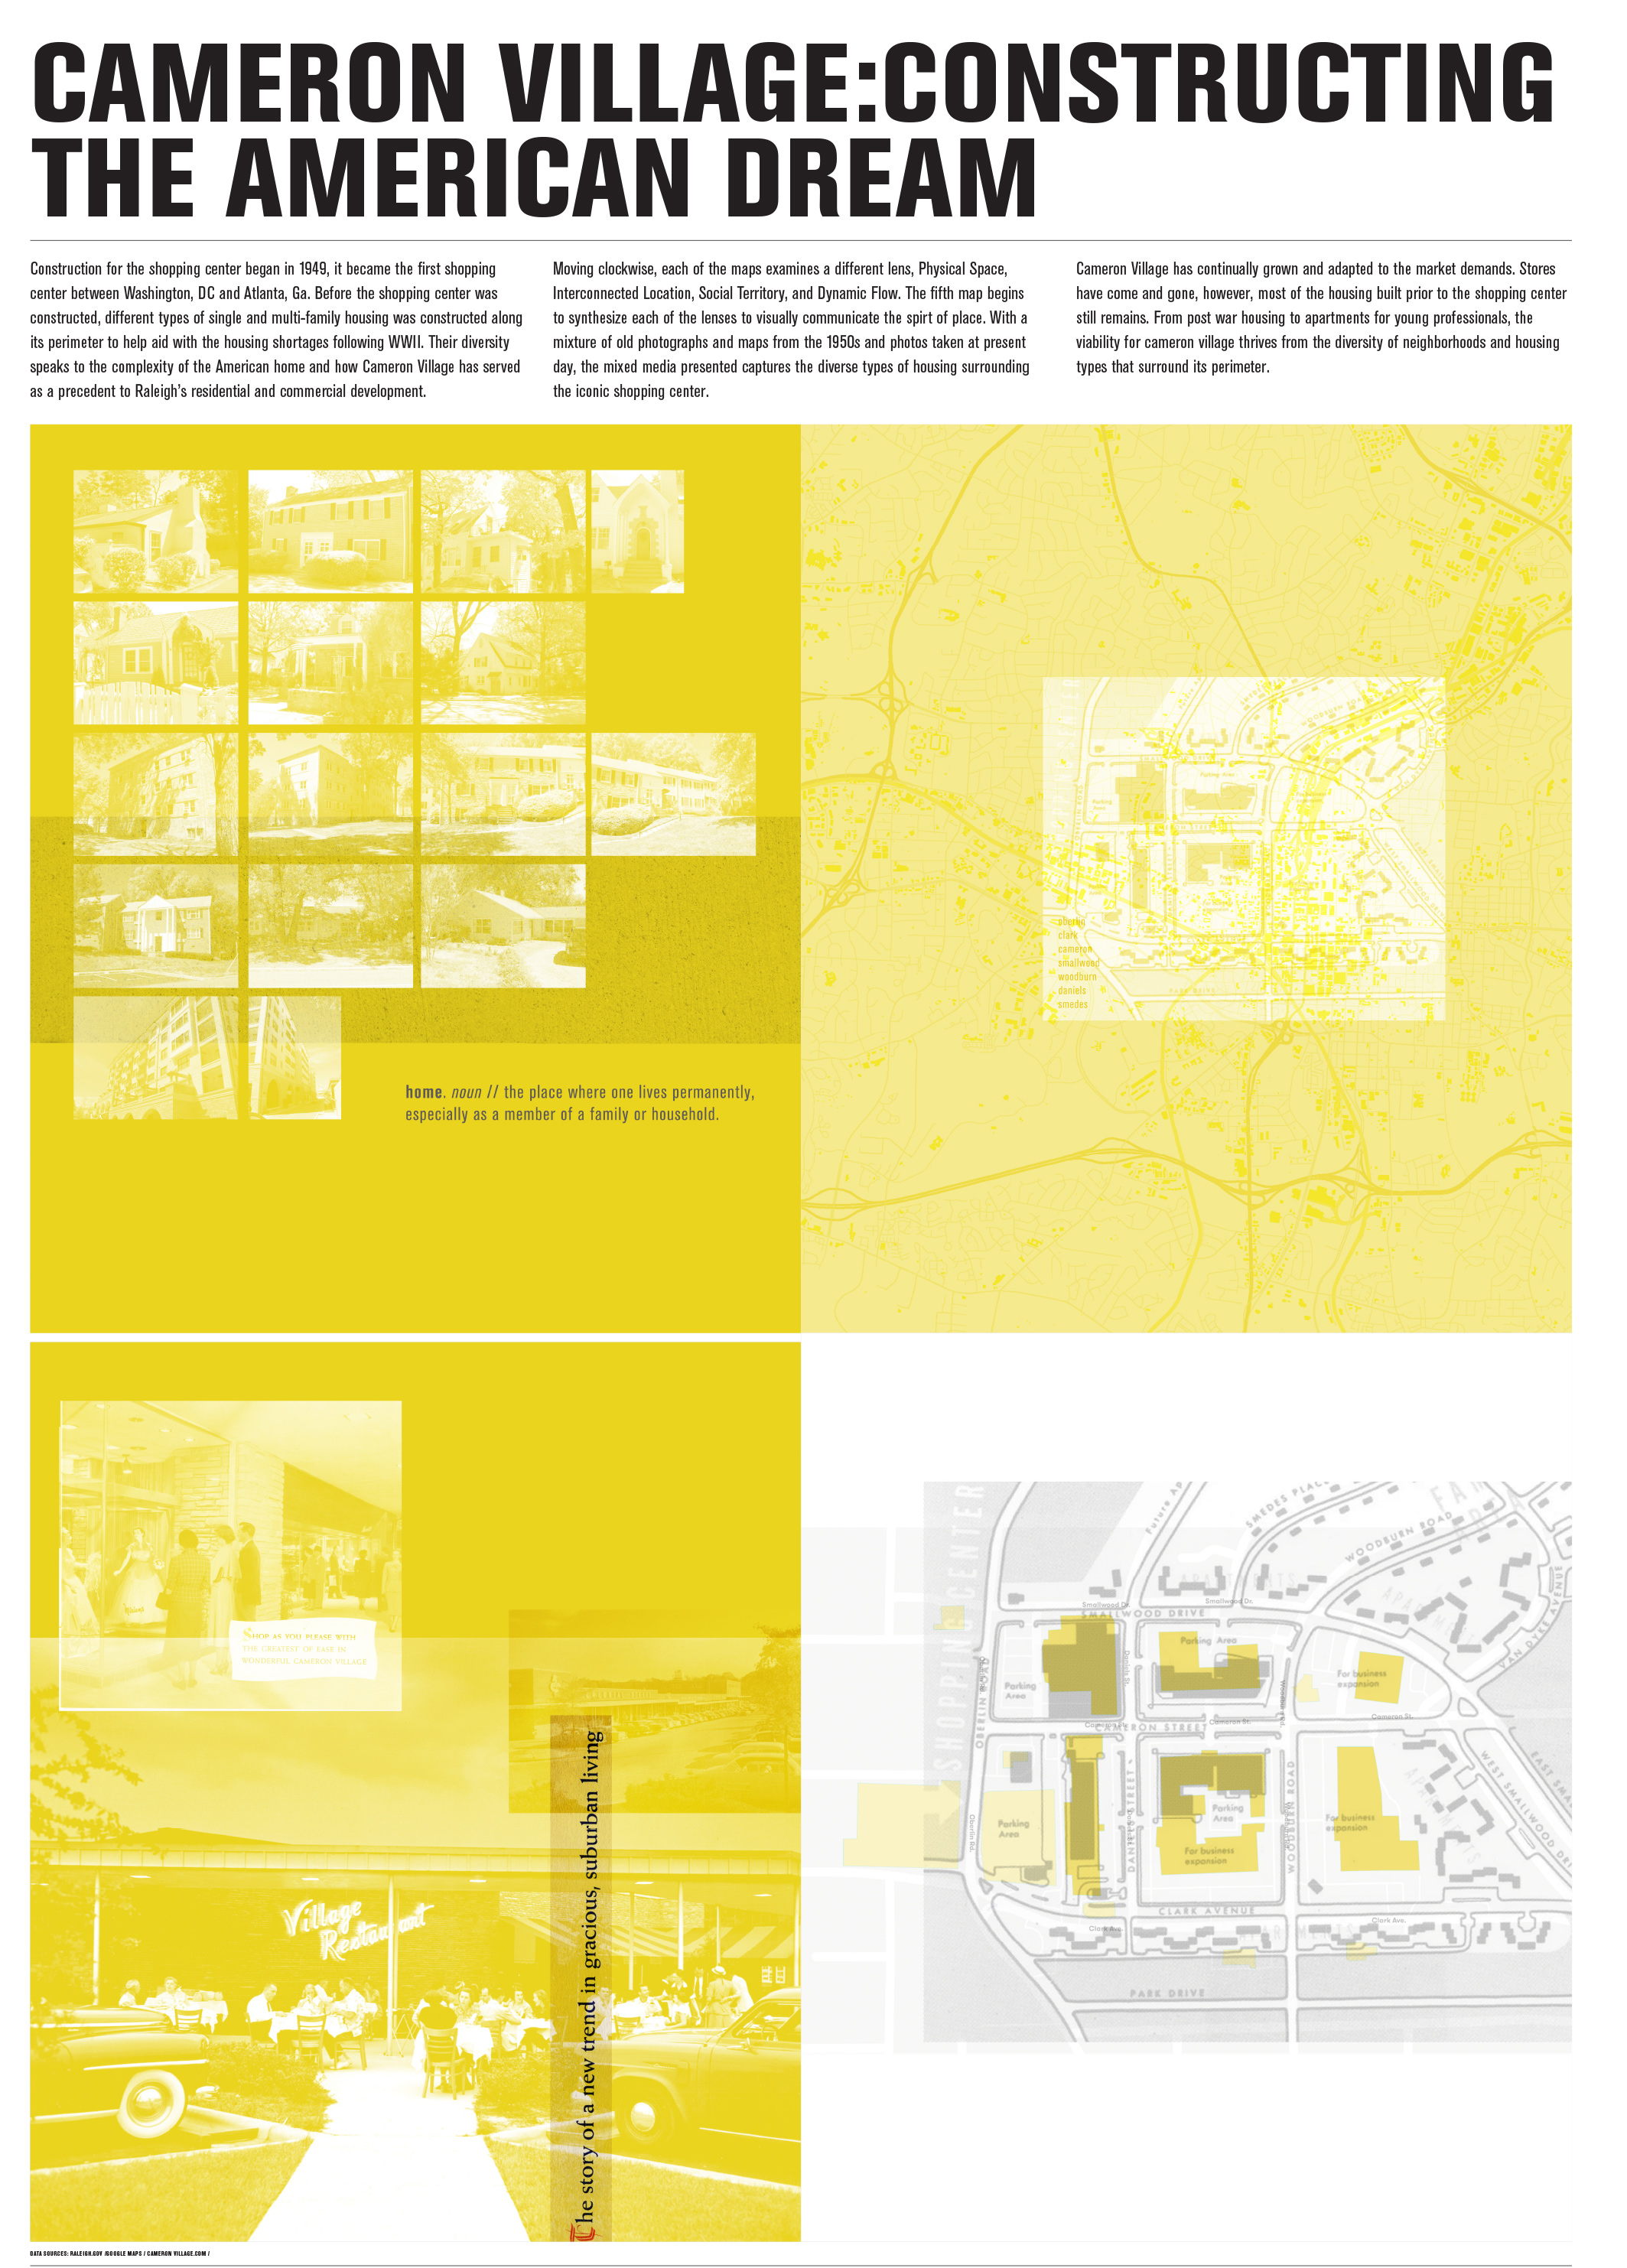
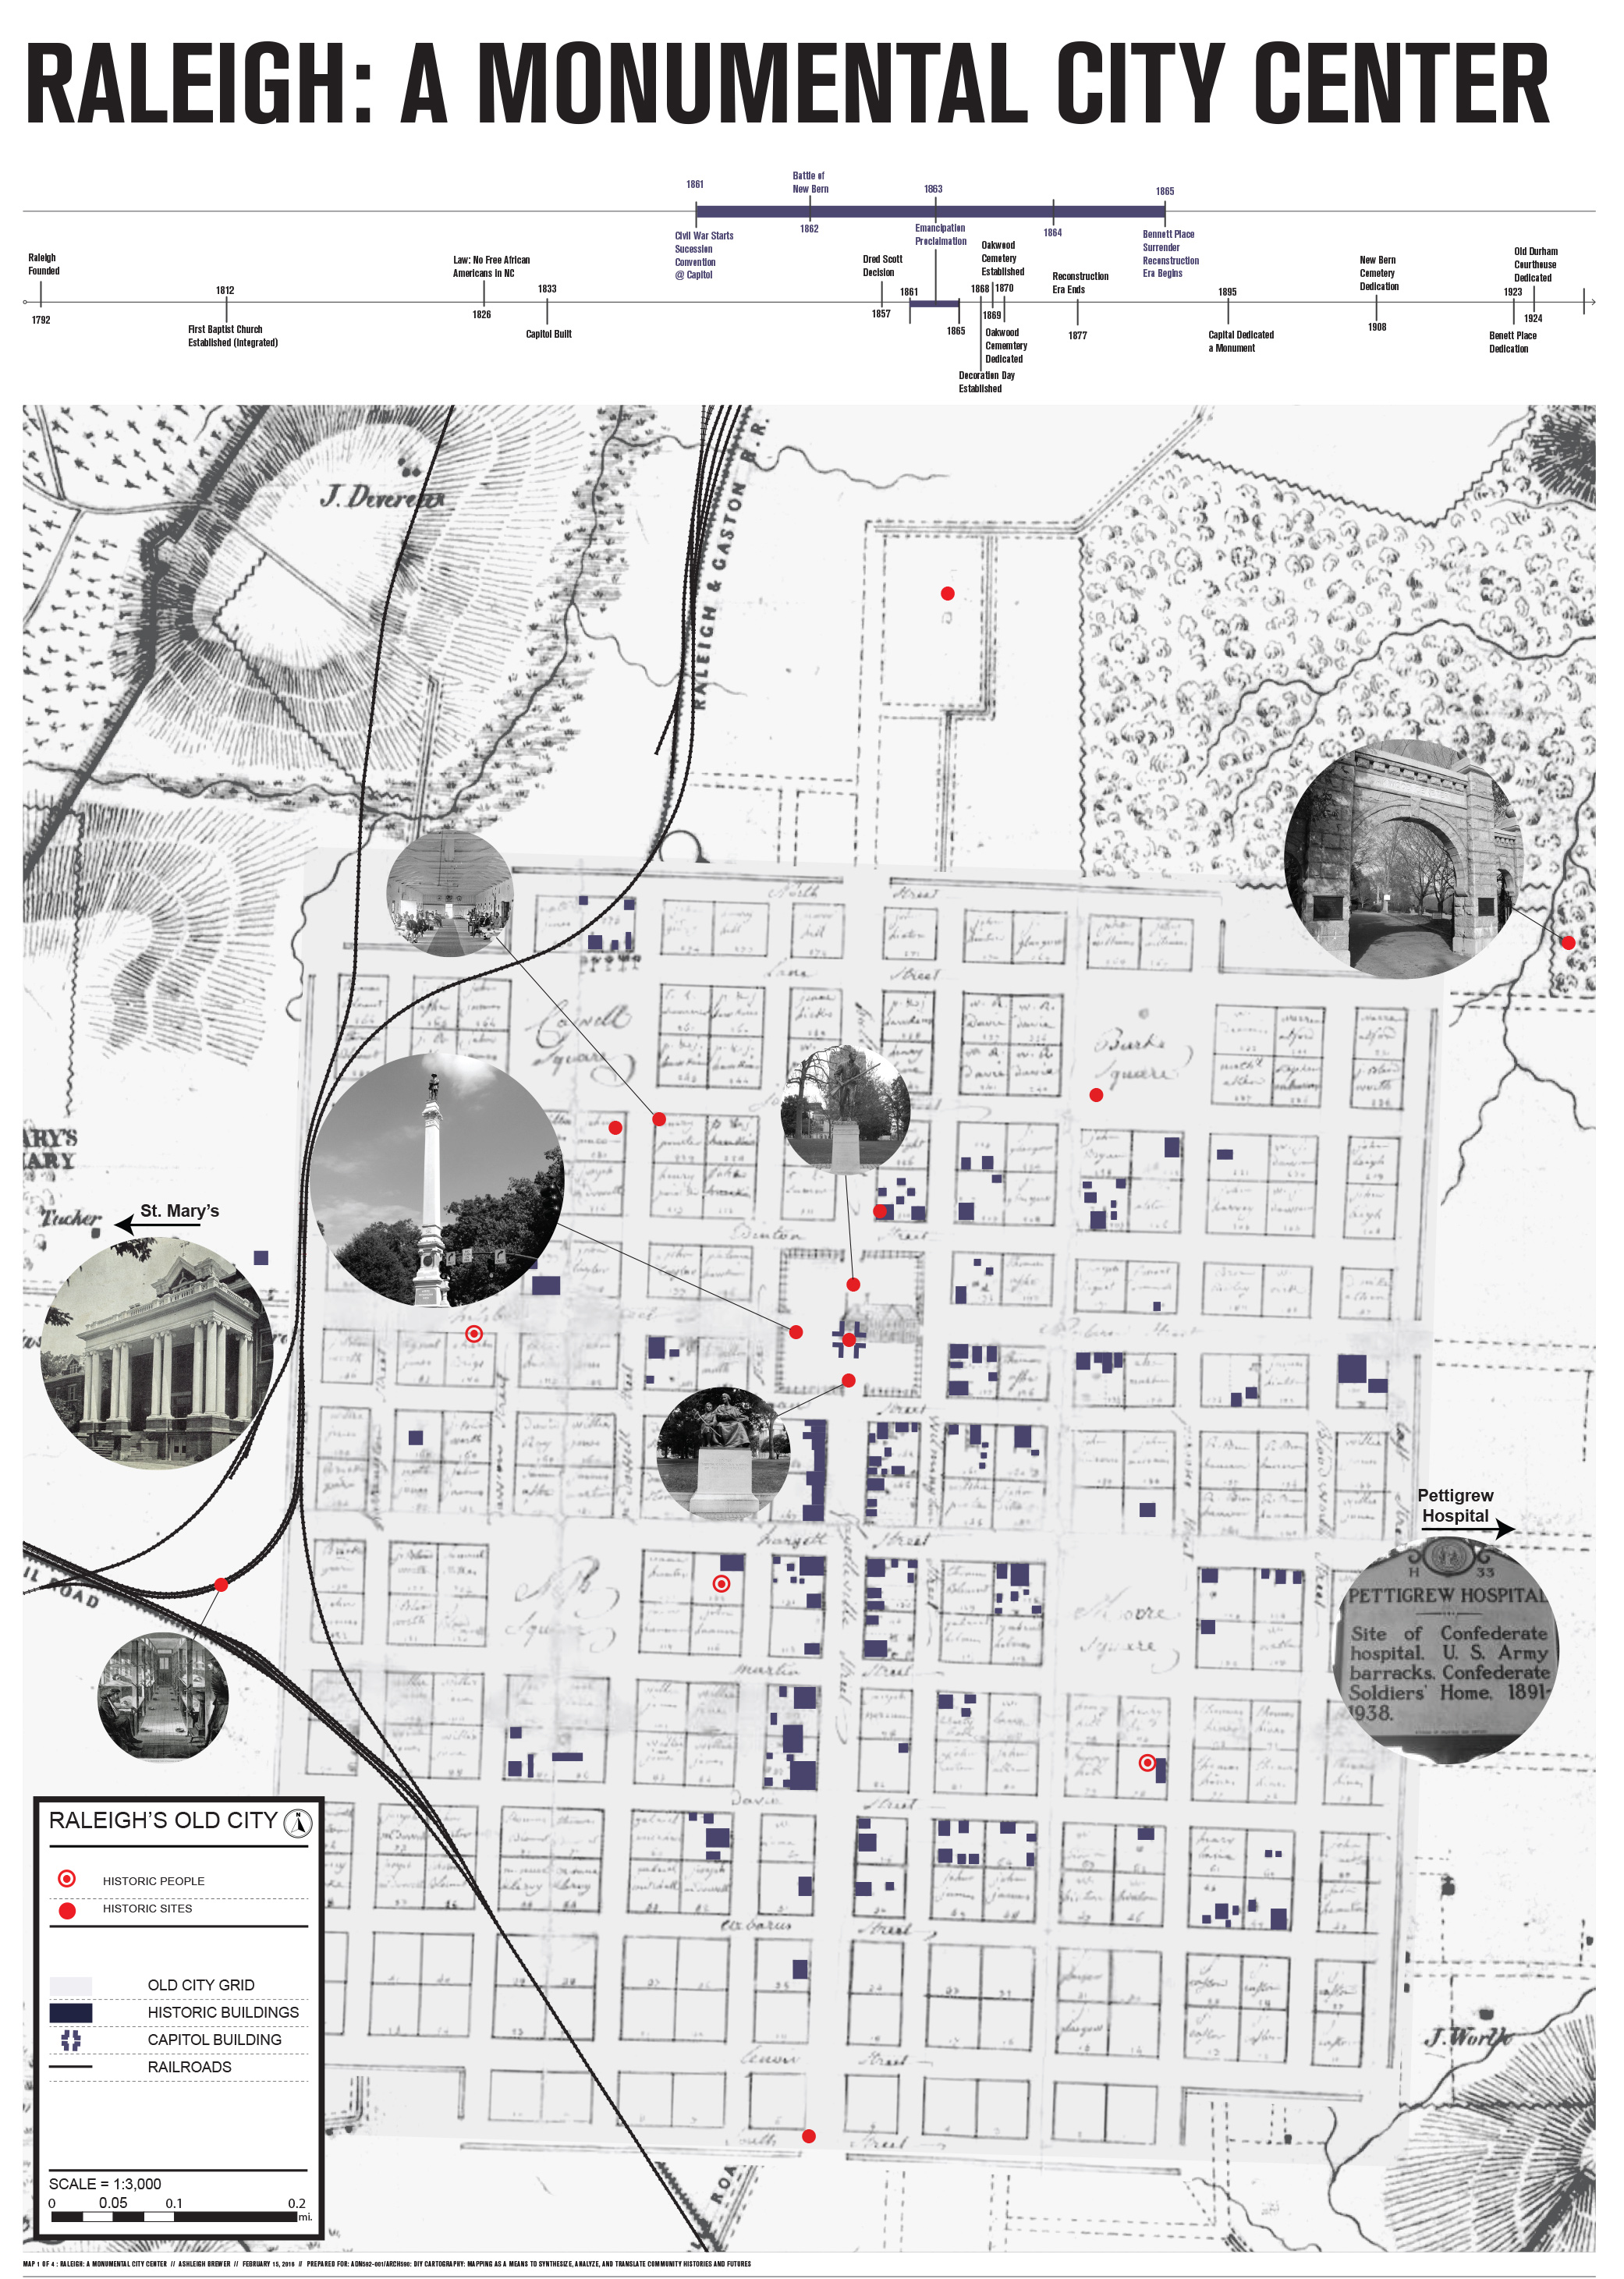
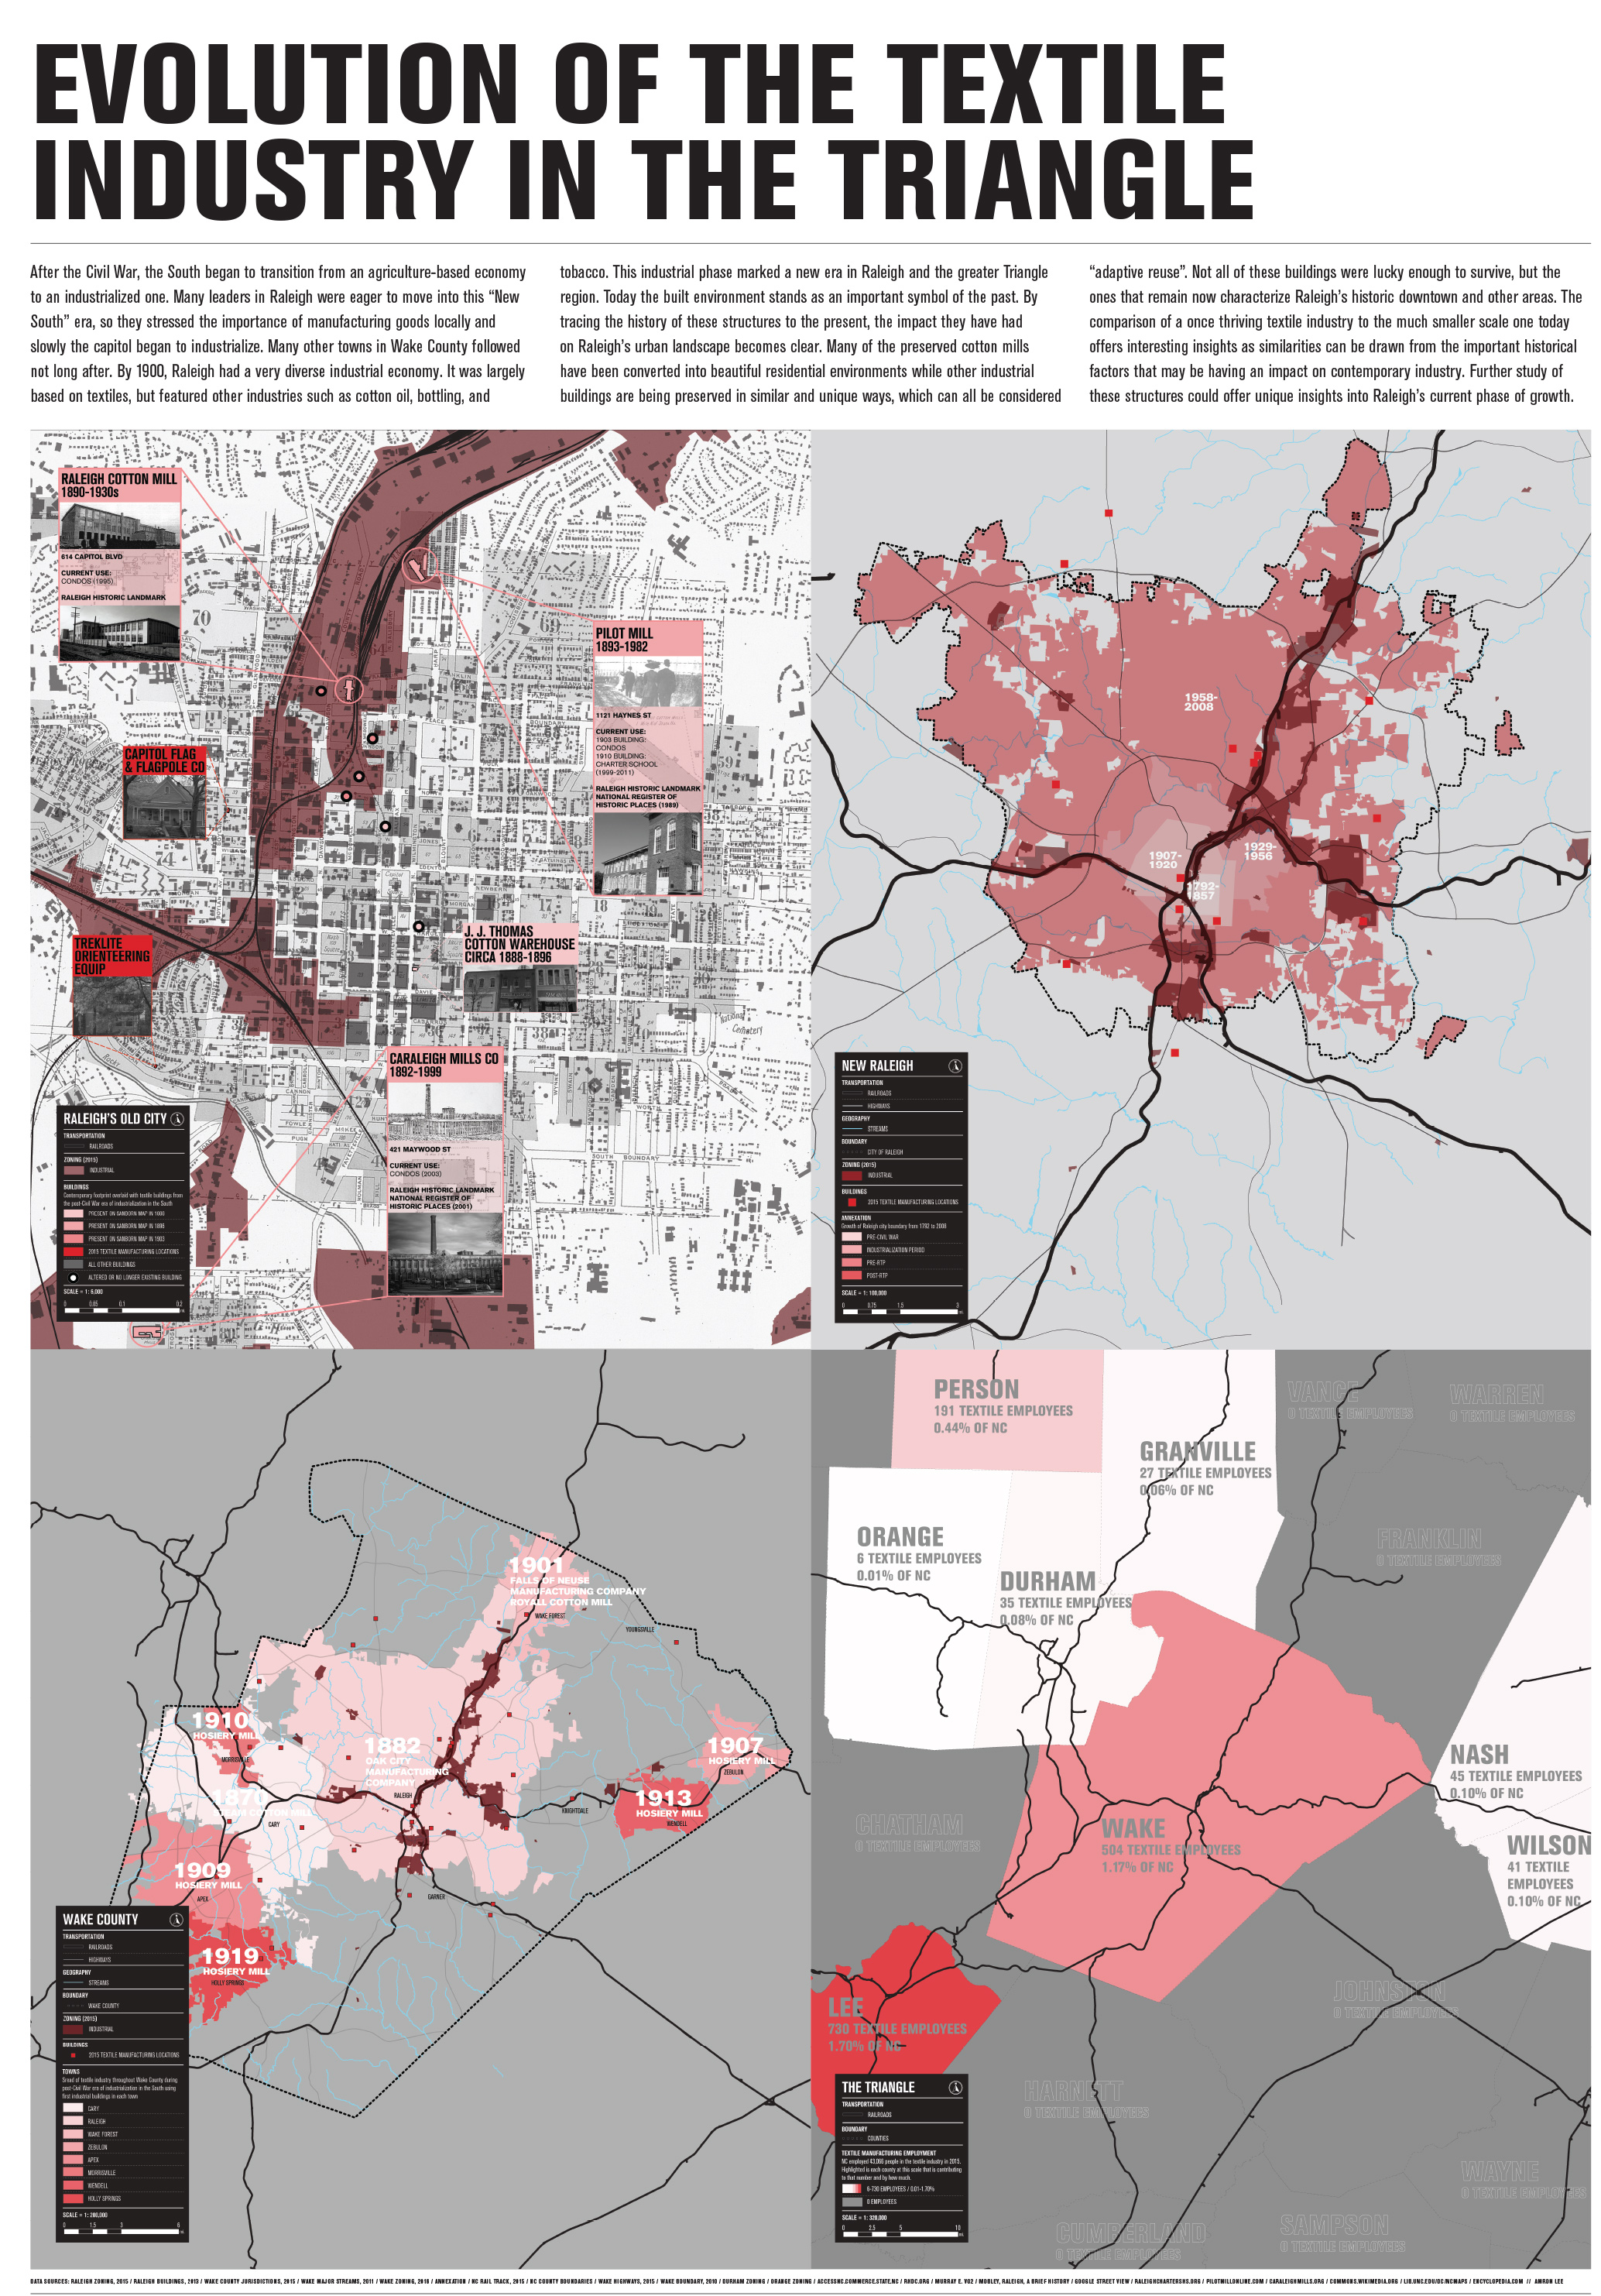
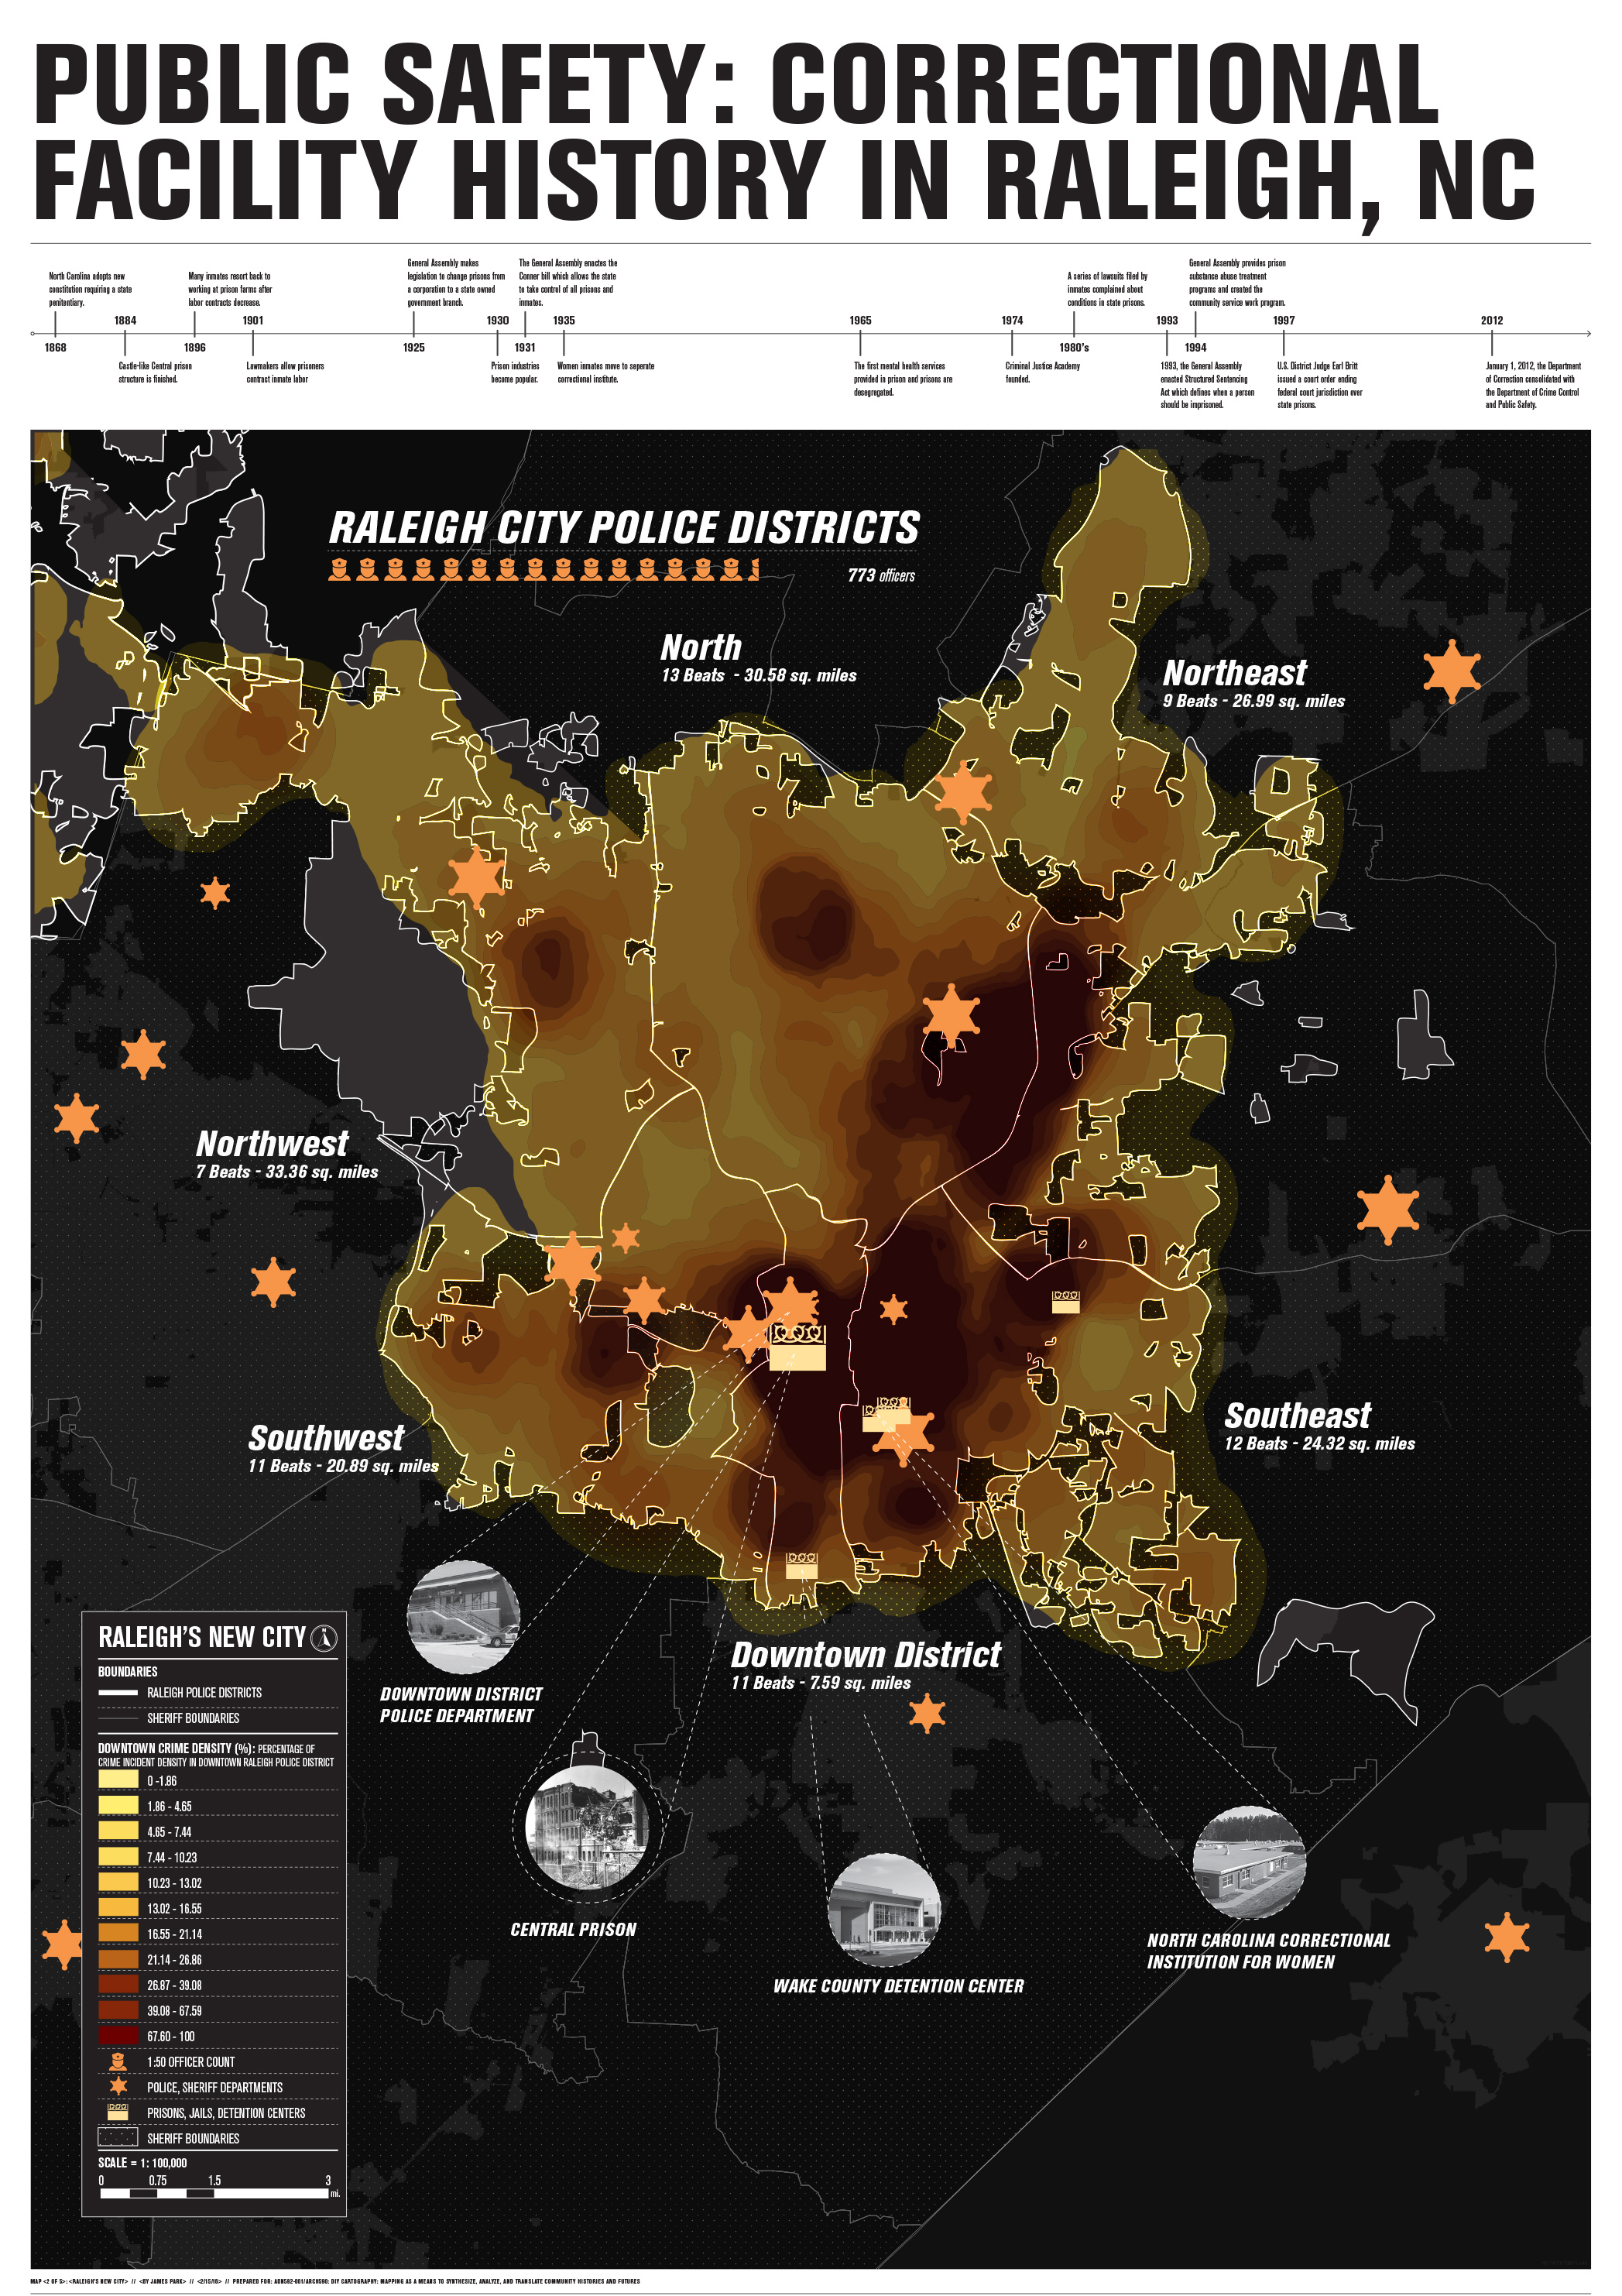
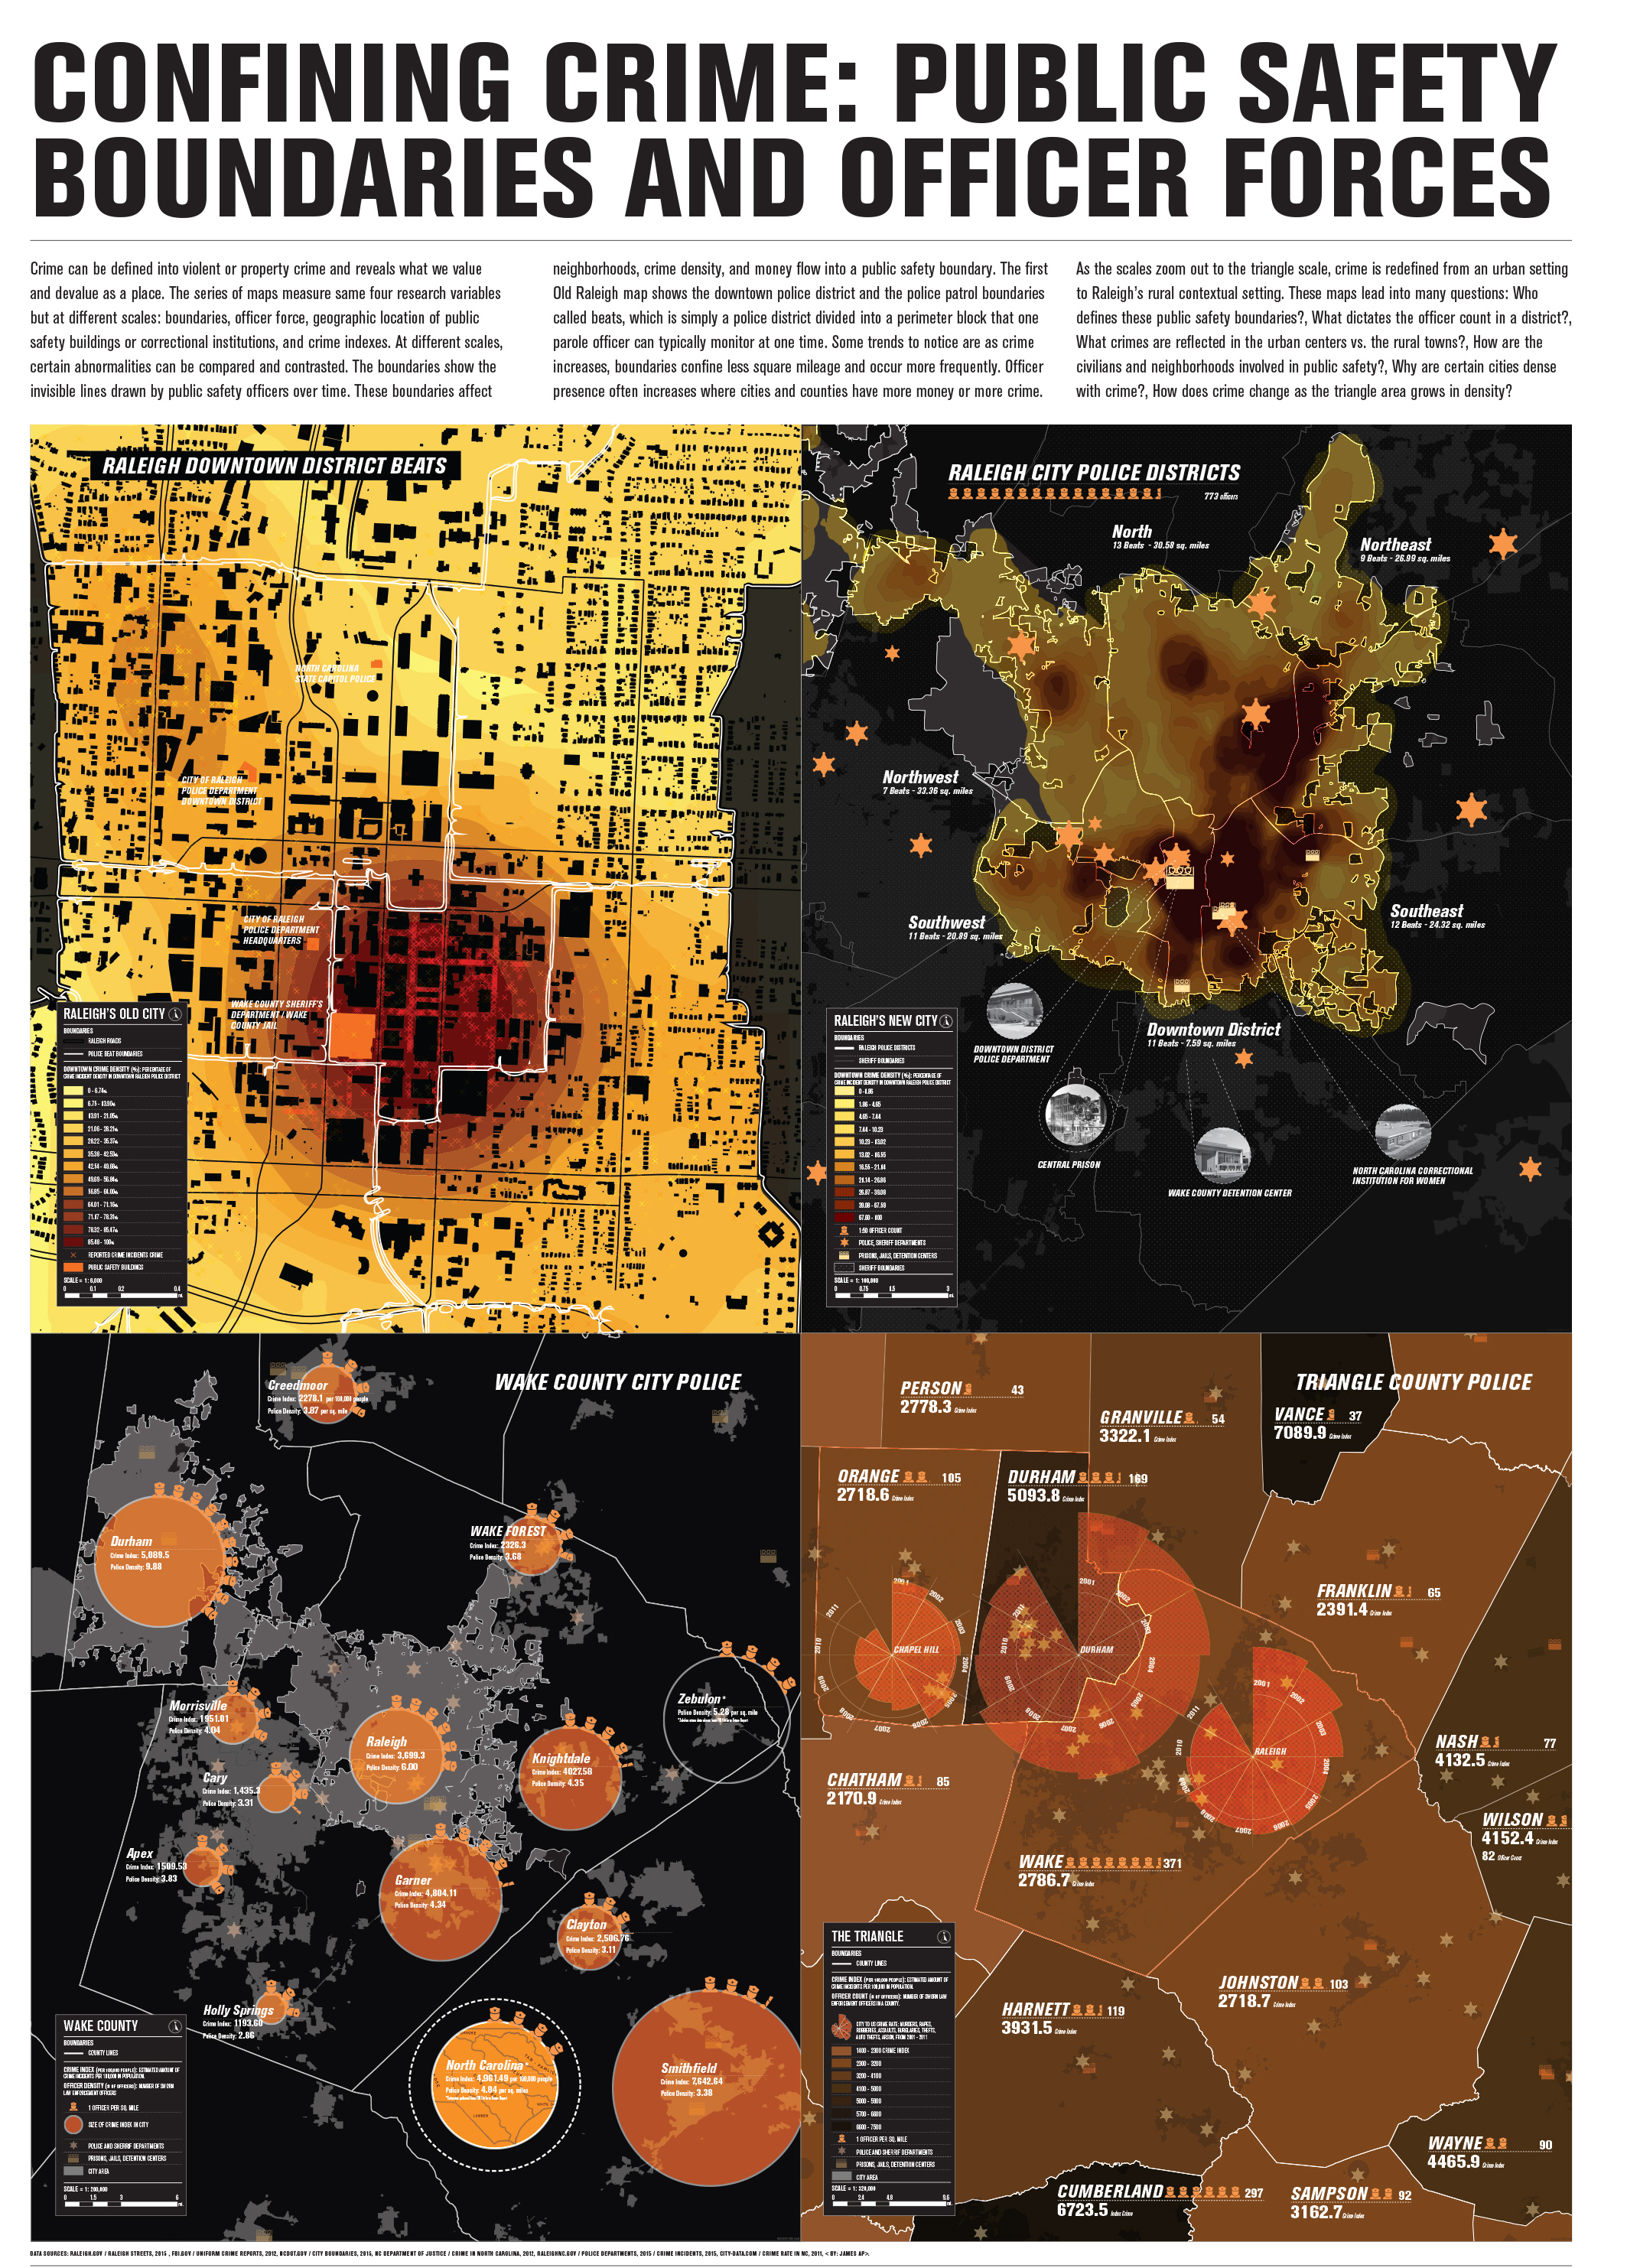
MAP SERIES 01: LOOKING AT THE NATURE OF RALEIGH’S HISTORY
Research Methodology: Archival Analysis
Mapping Methodology: Spatio-Temporal Maps
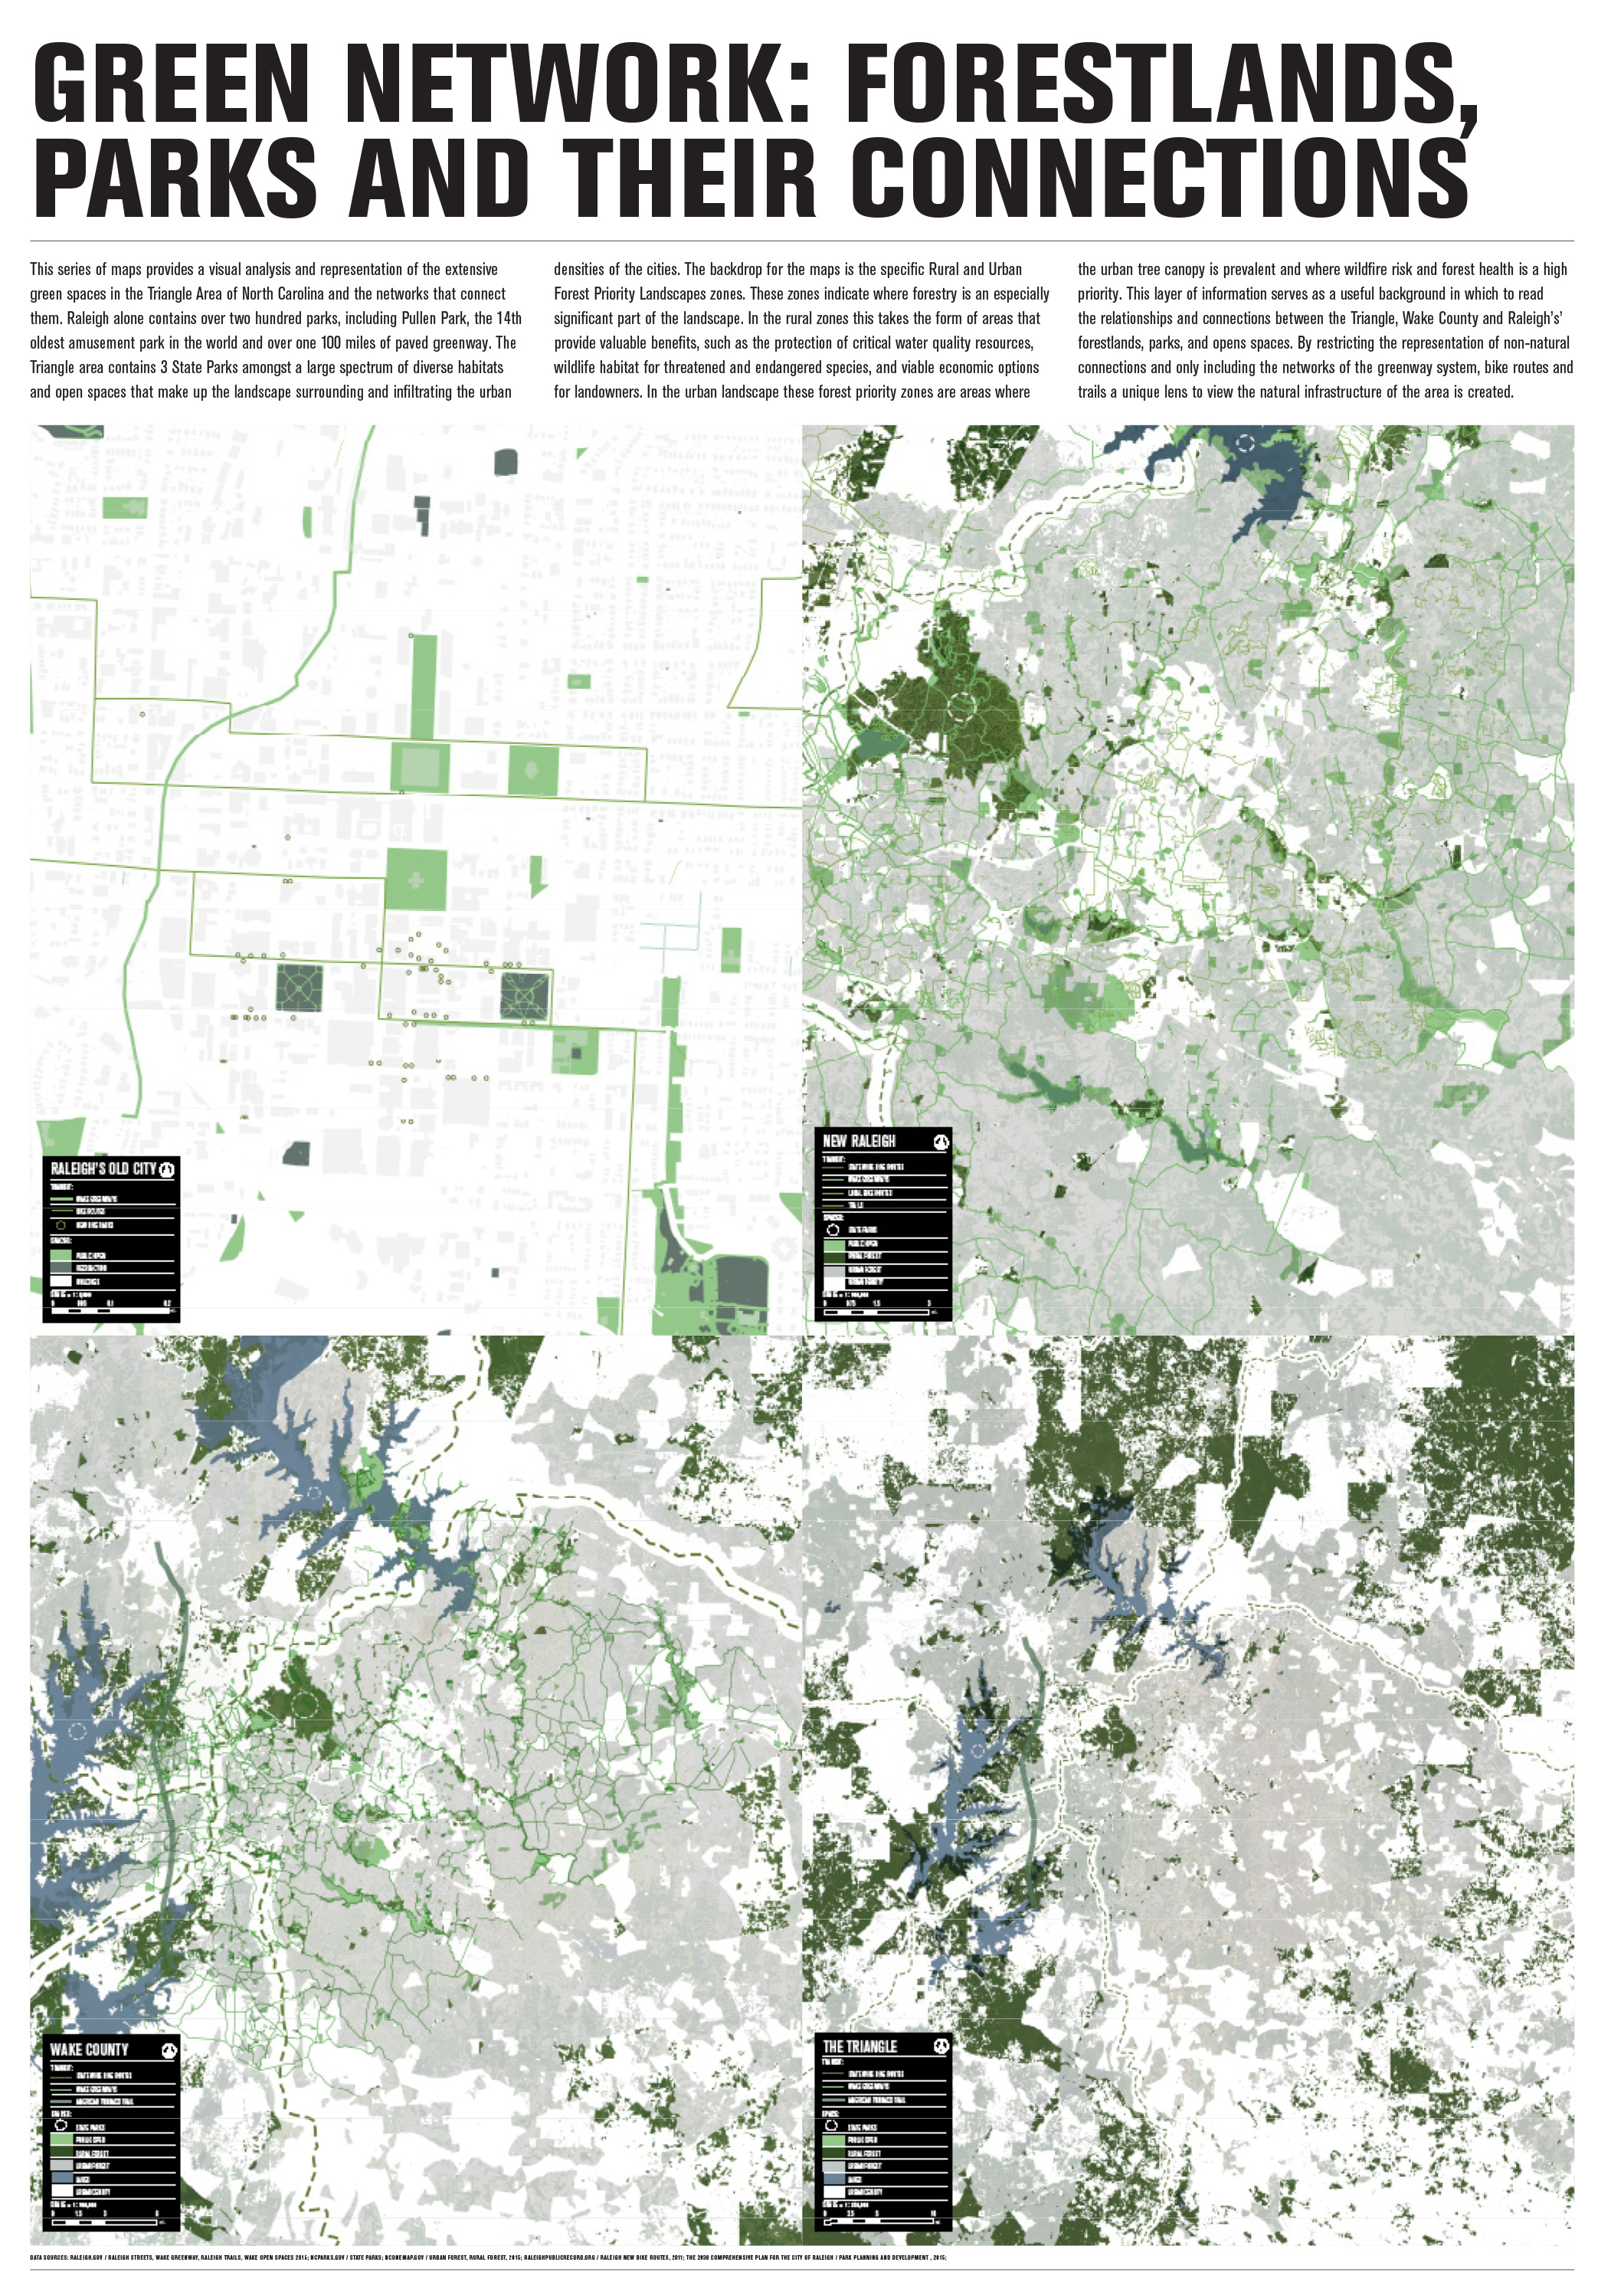
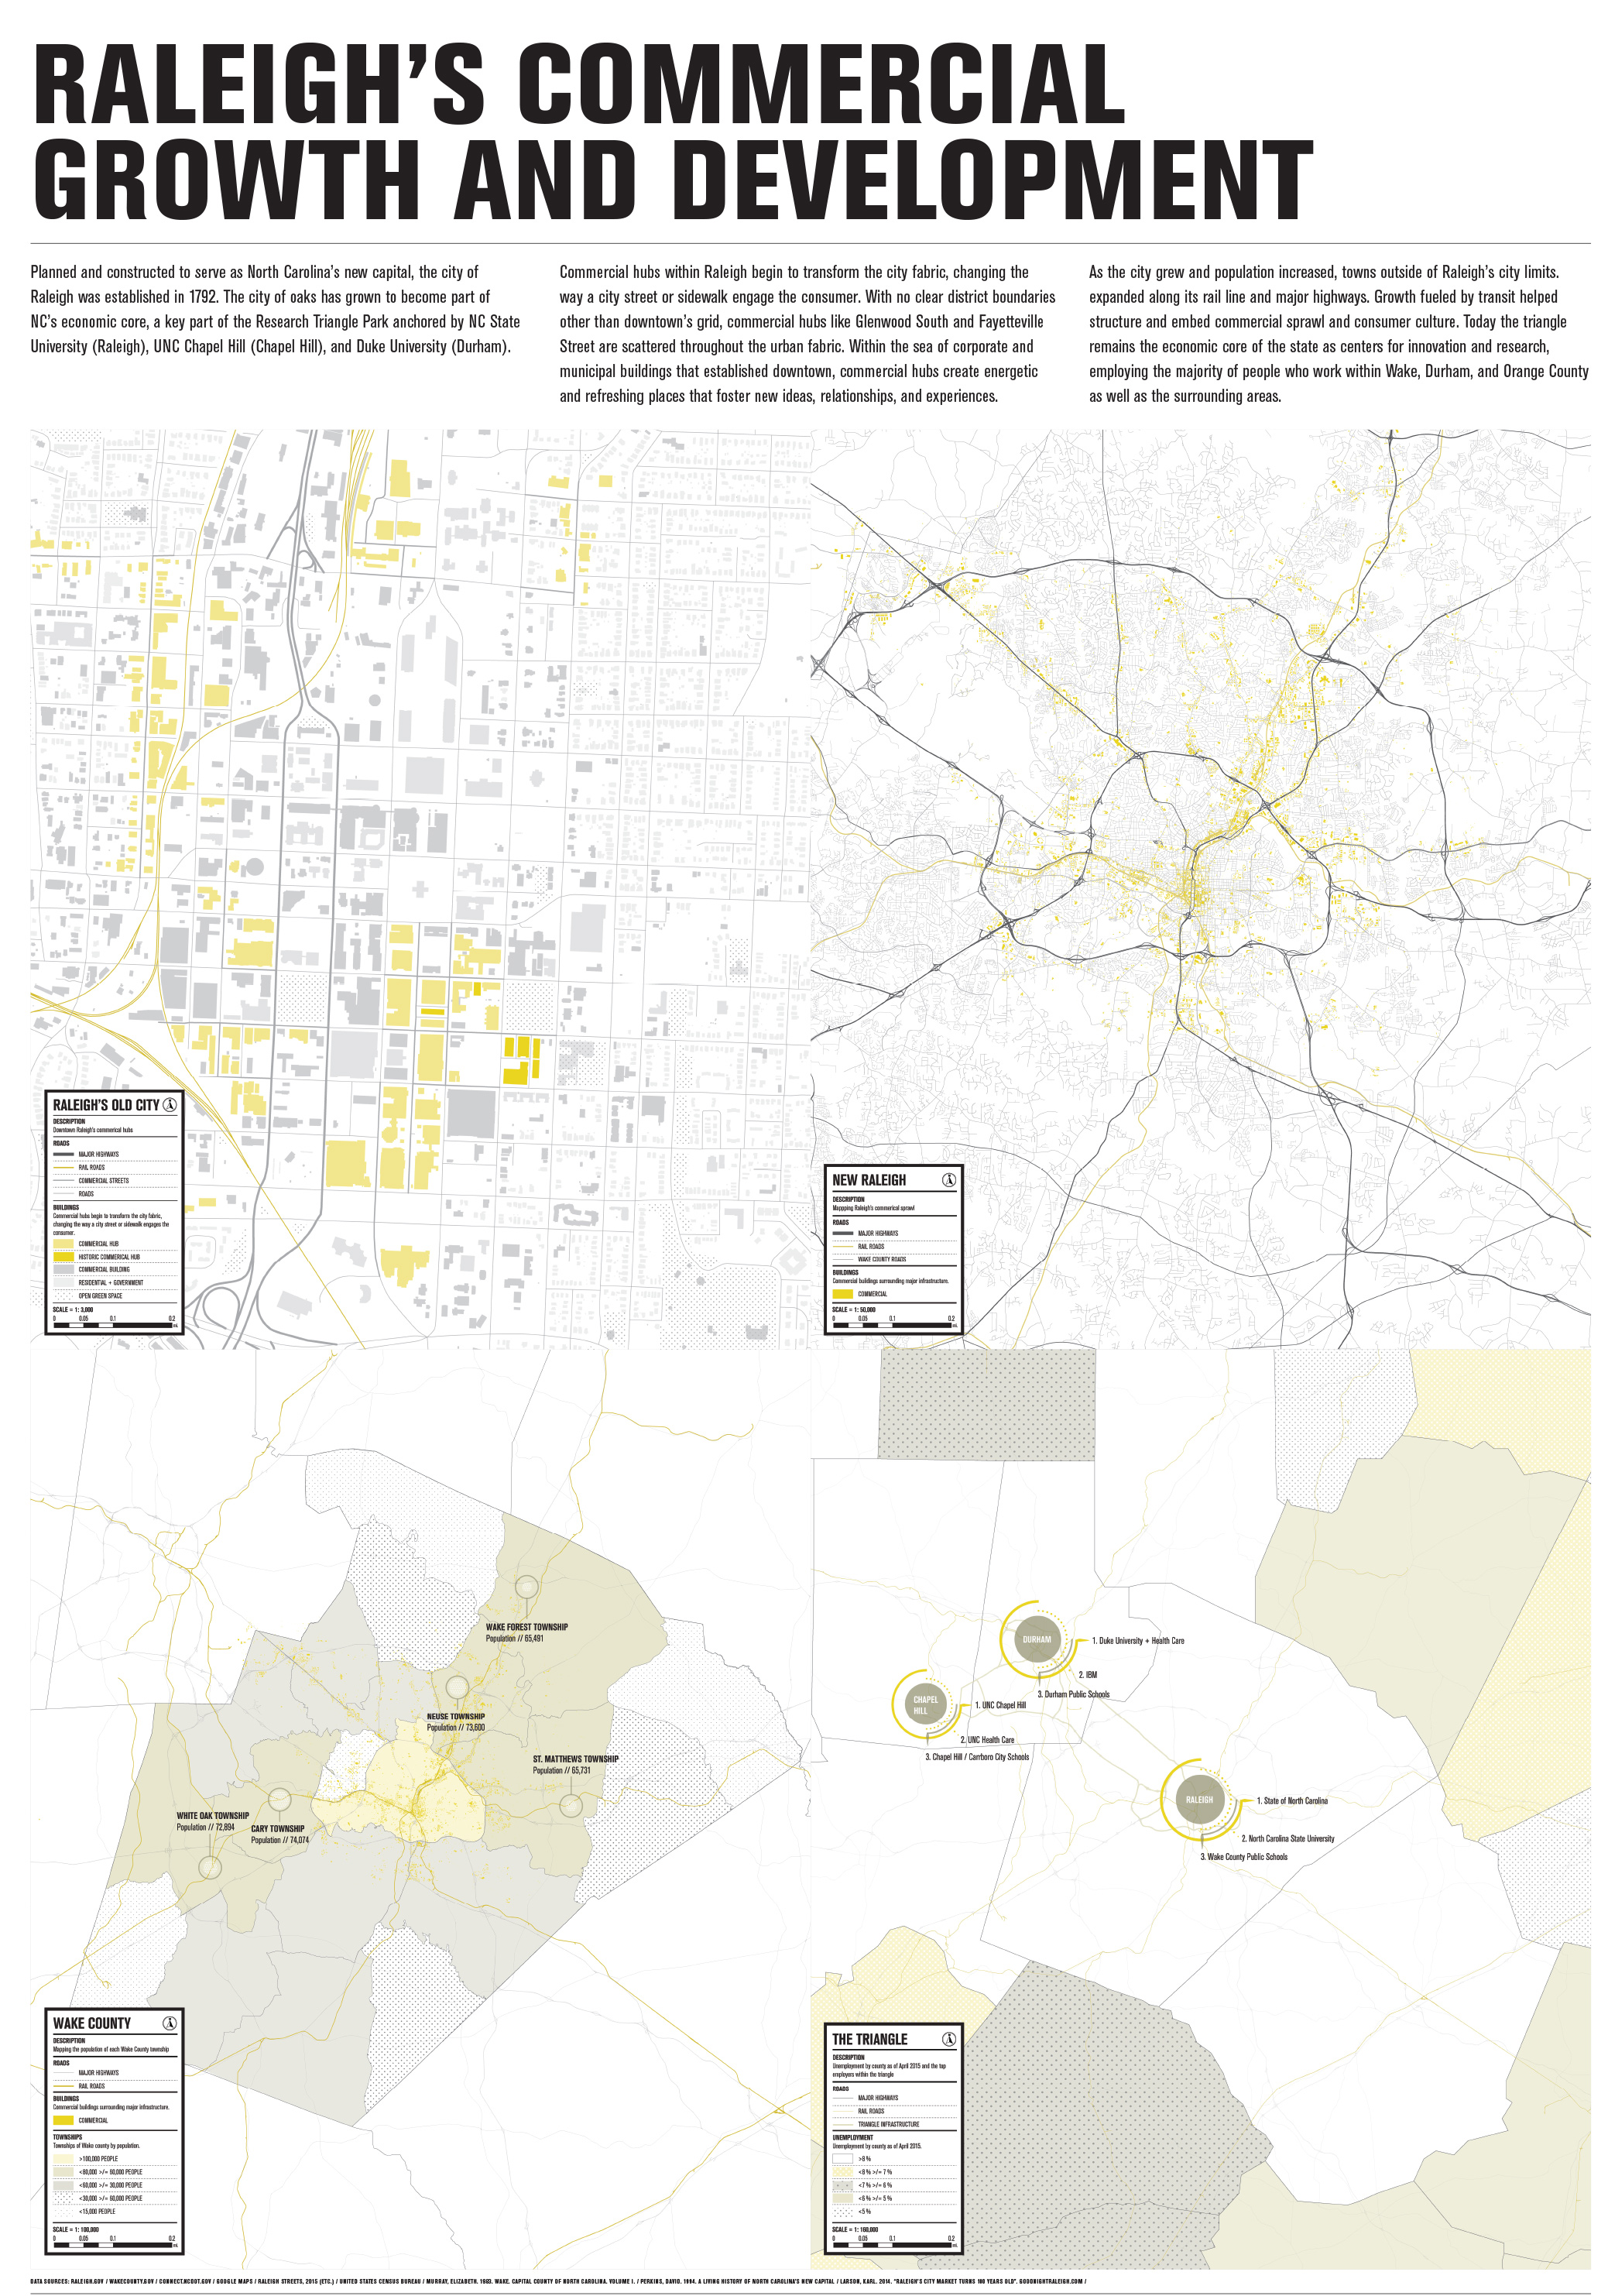
Working in cross-disciplinary teams, students mapped the development of the city through 6 topical lenses (natural history, social city, physical city, economy, politics, arts and culture). In these initial maps, which look at discrete components of the city over time, students paid special attention to how scale informs and transforms the message of the map through altering the resolution and visible measurements of the systems depicted.
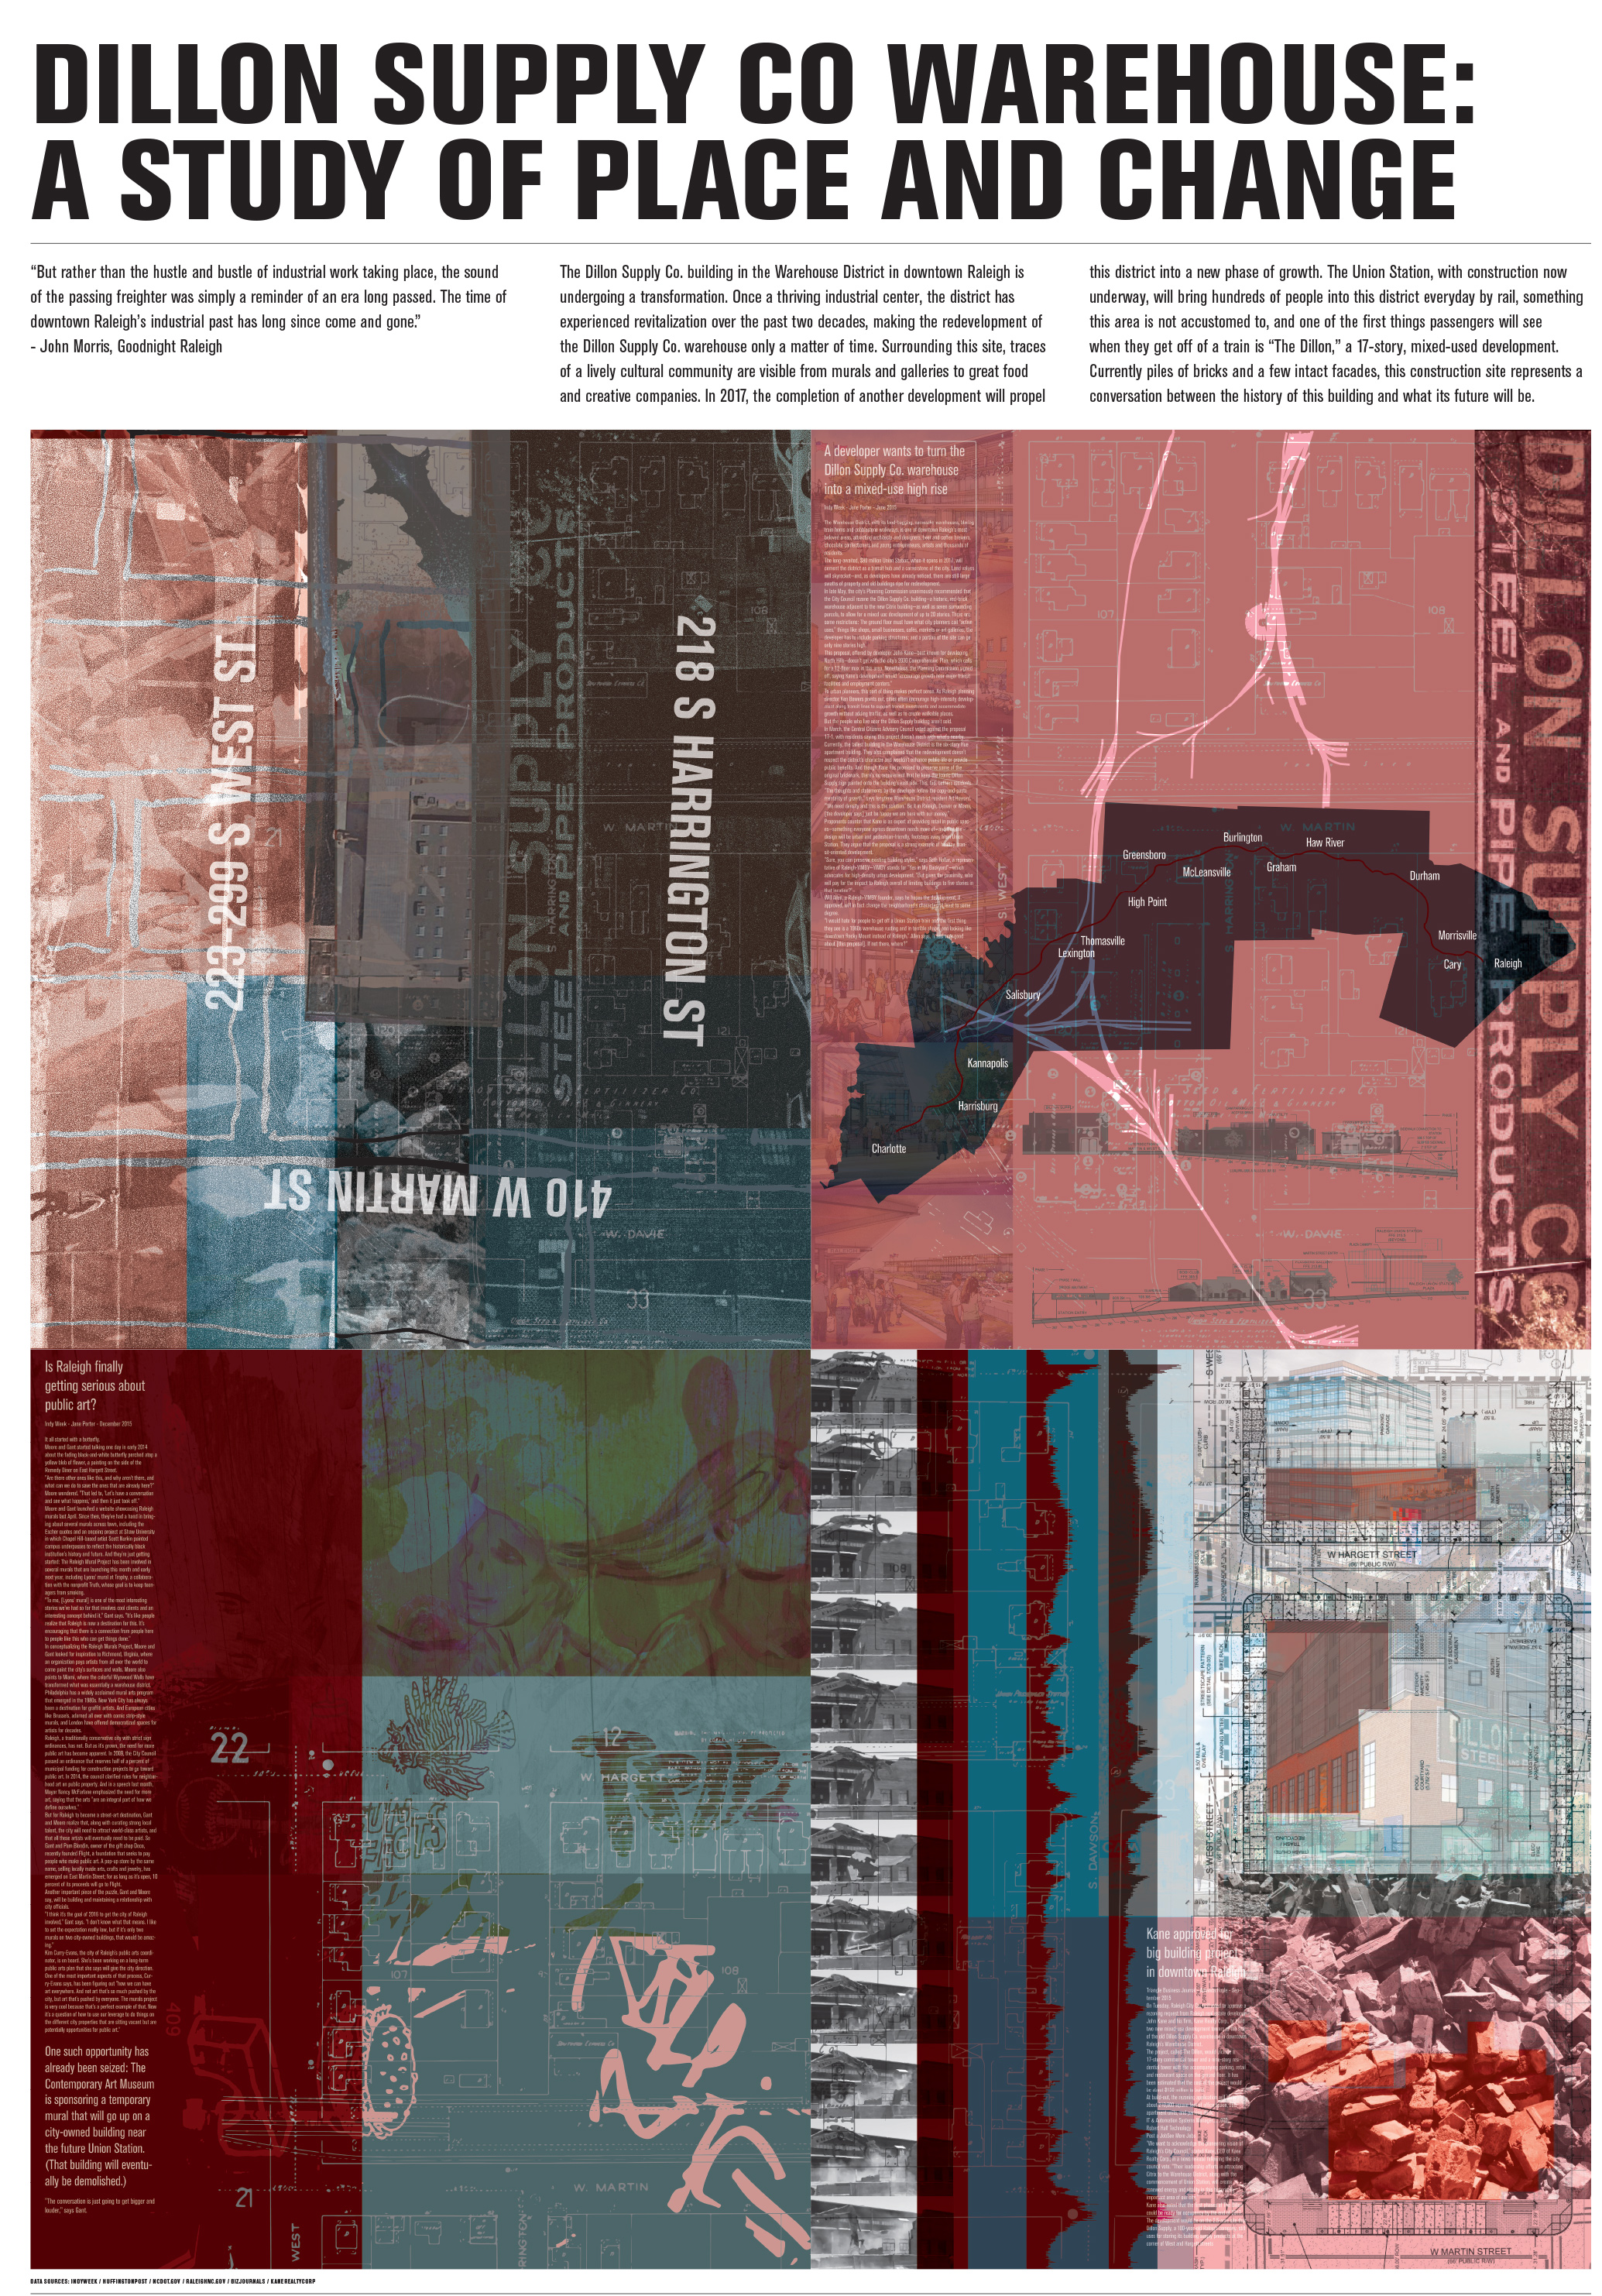
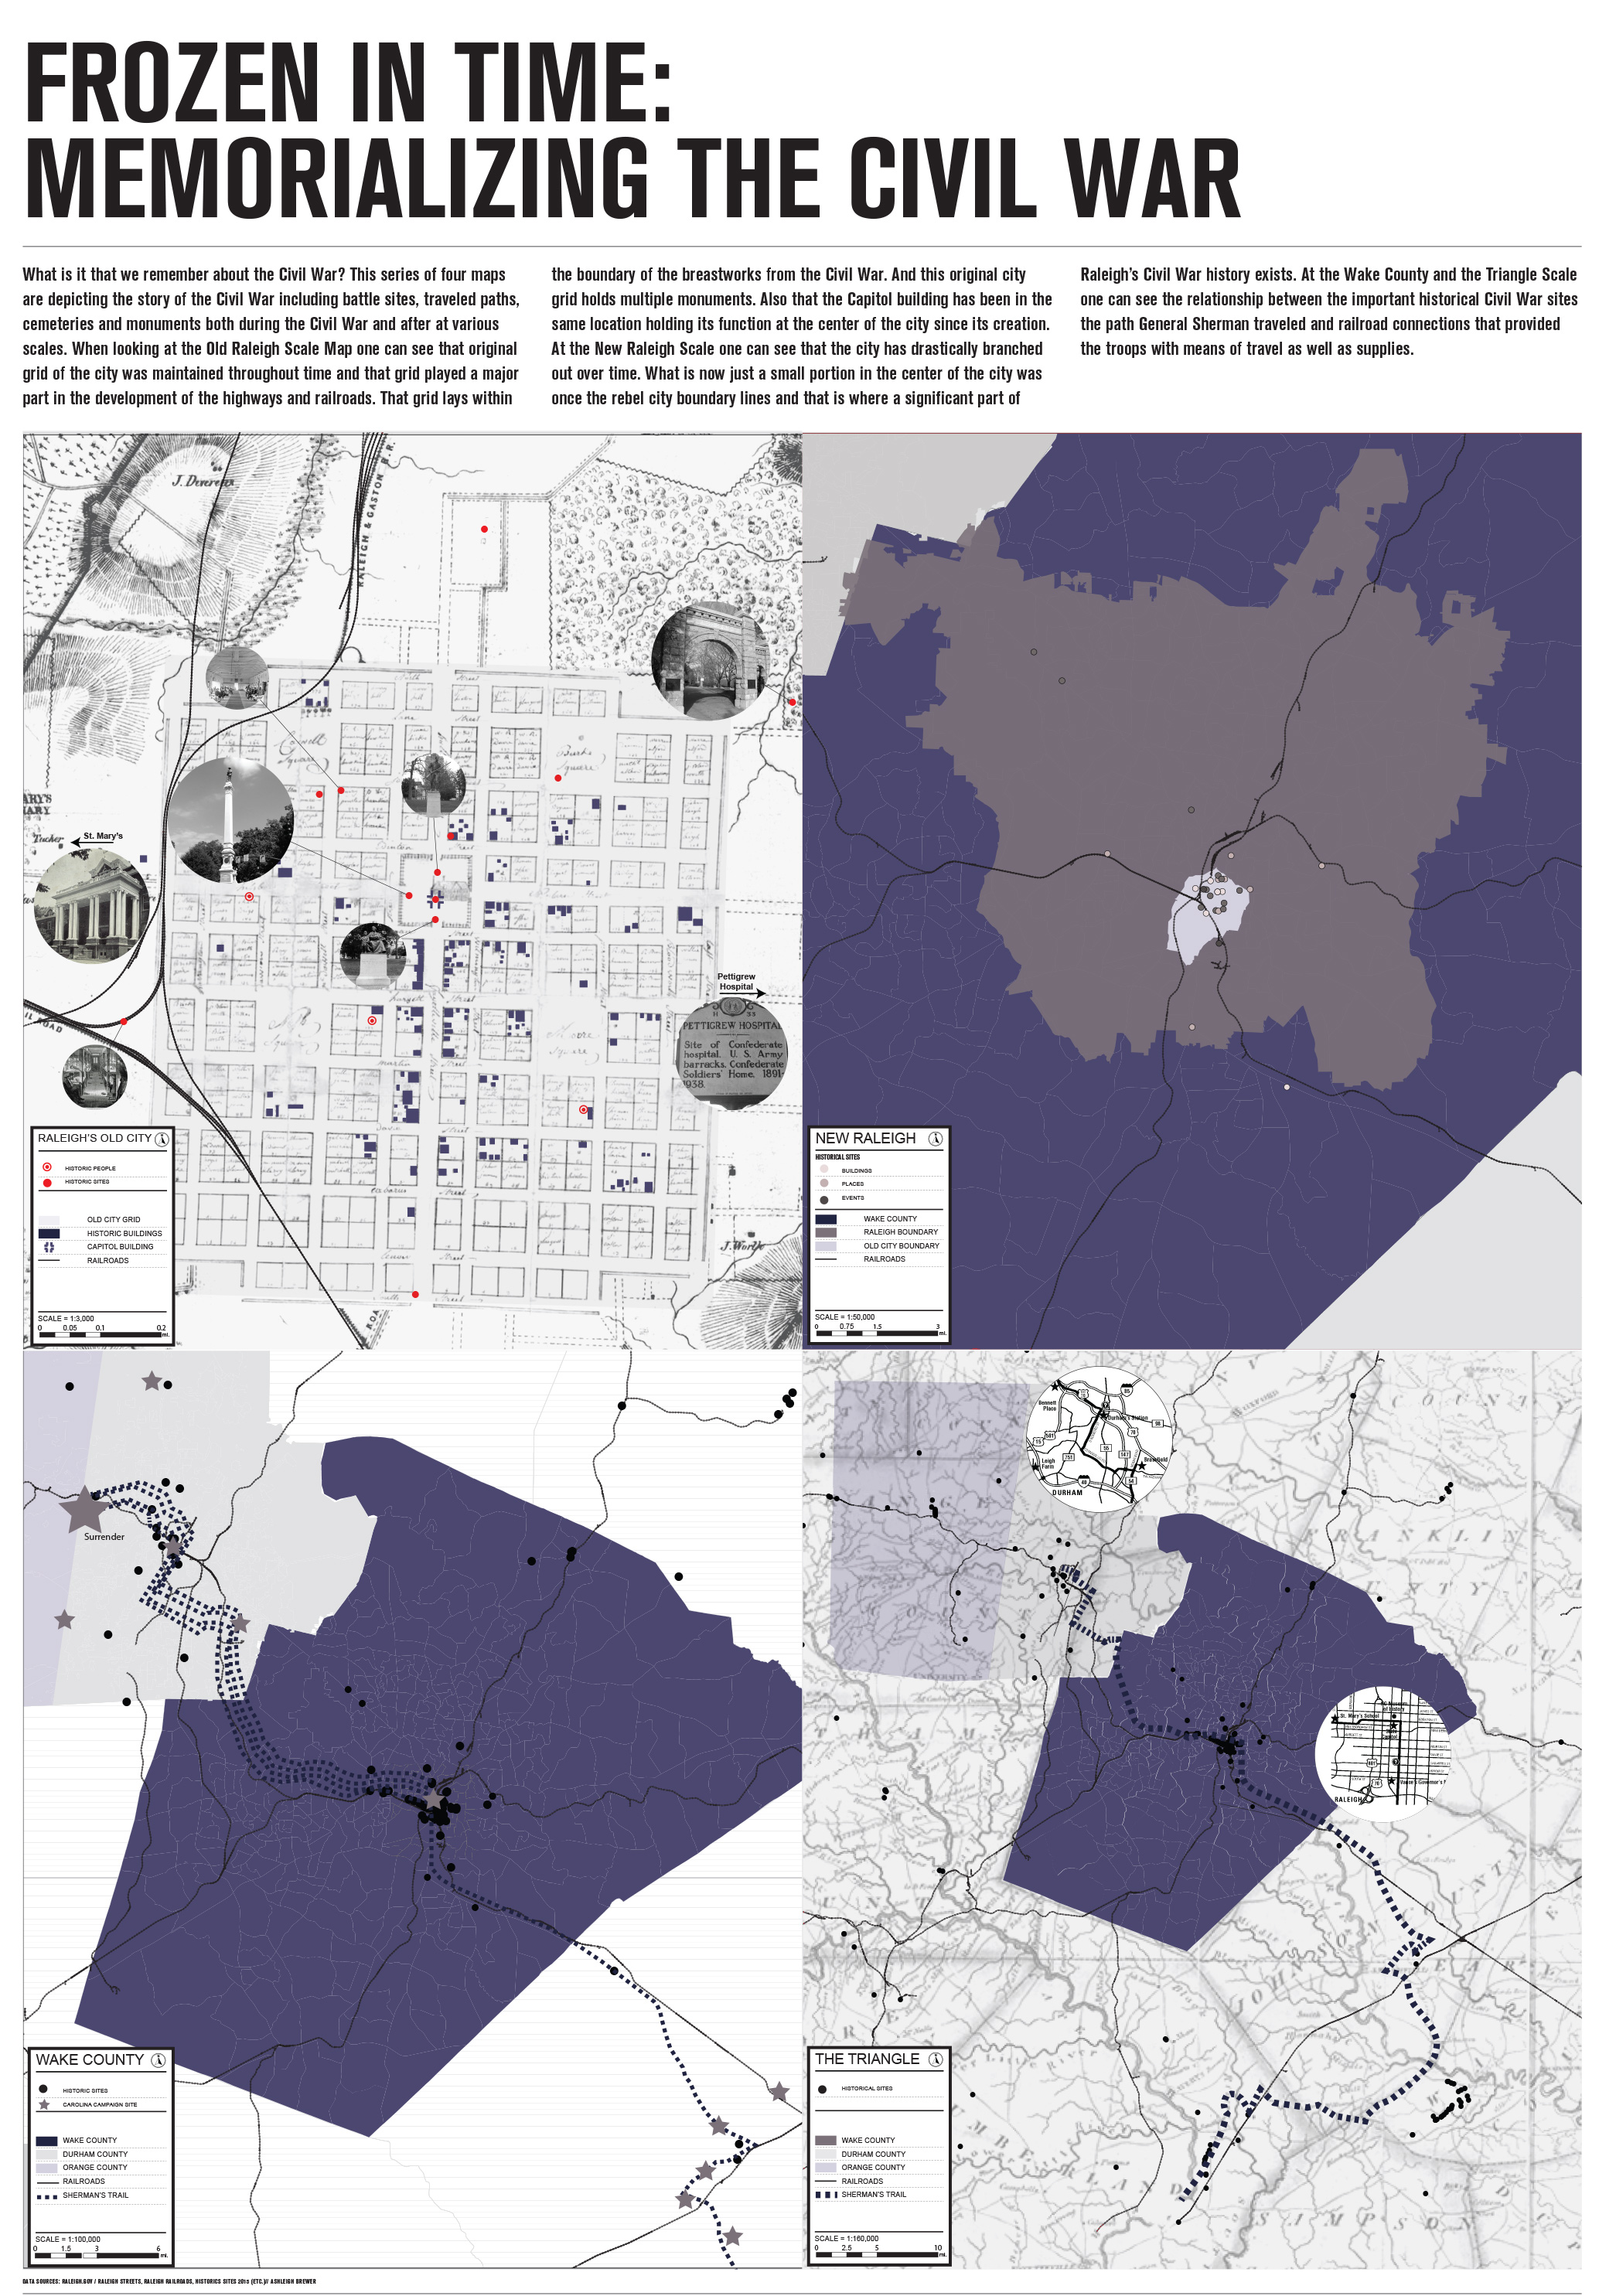
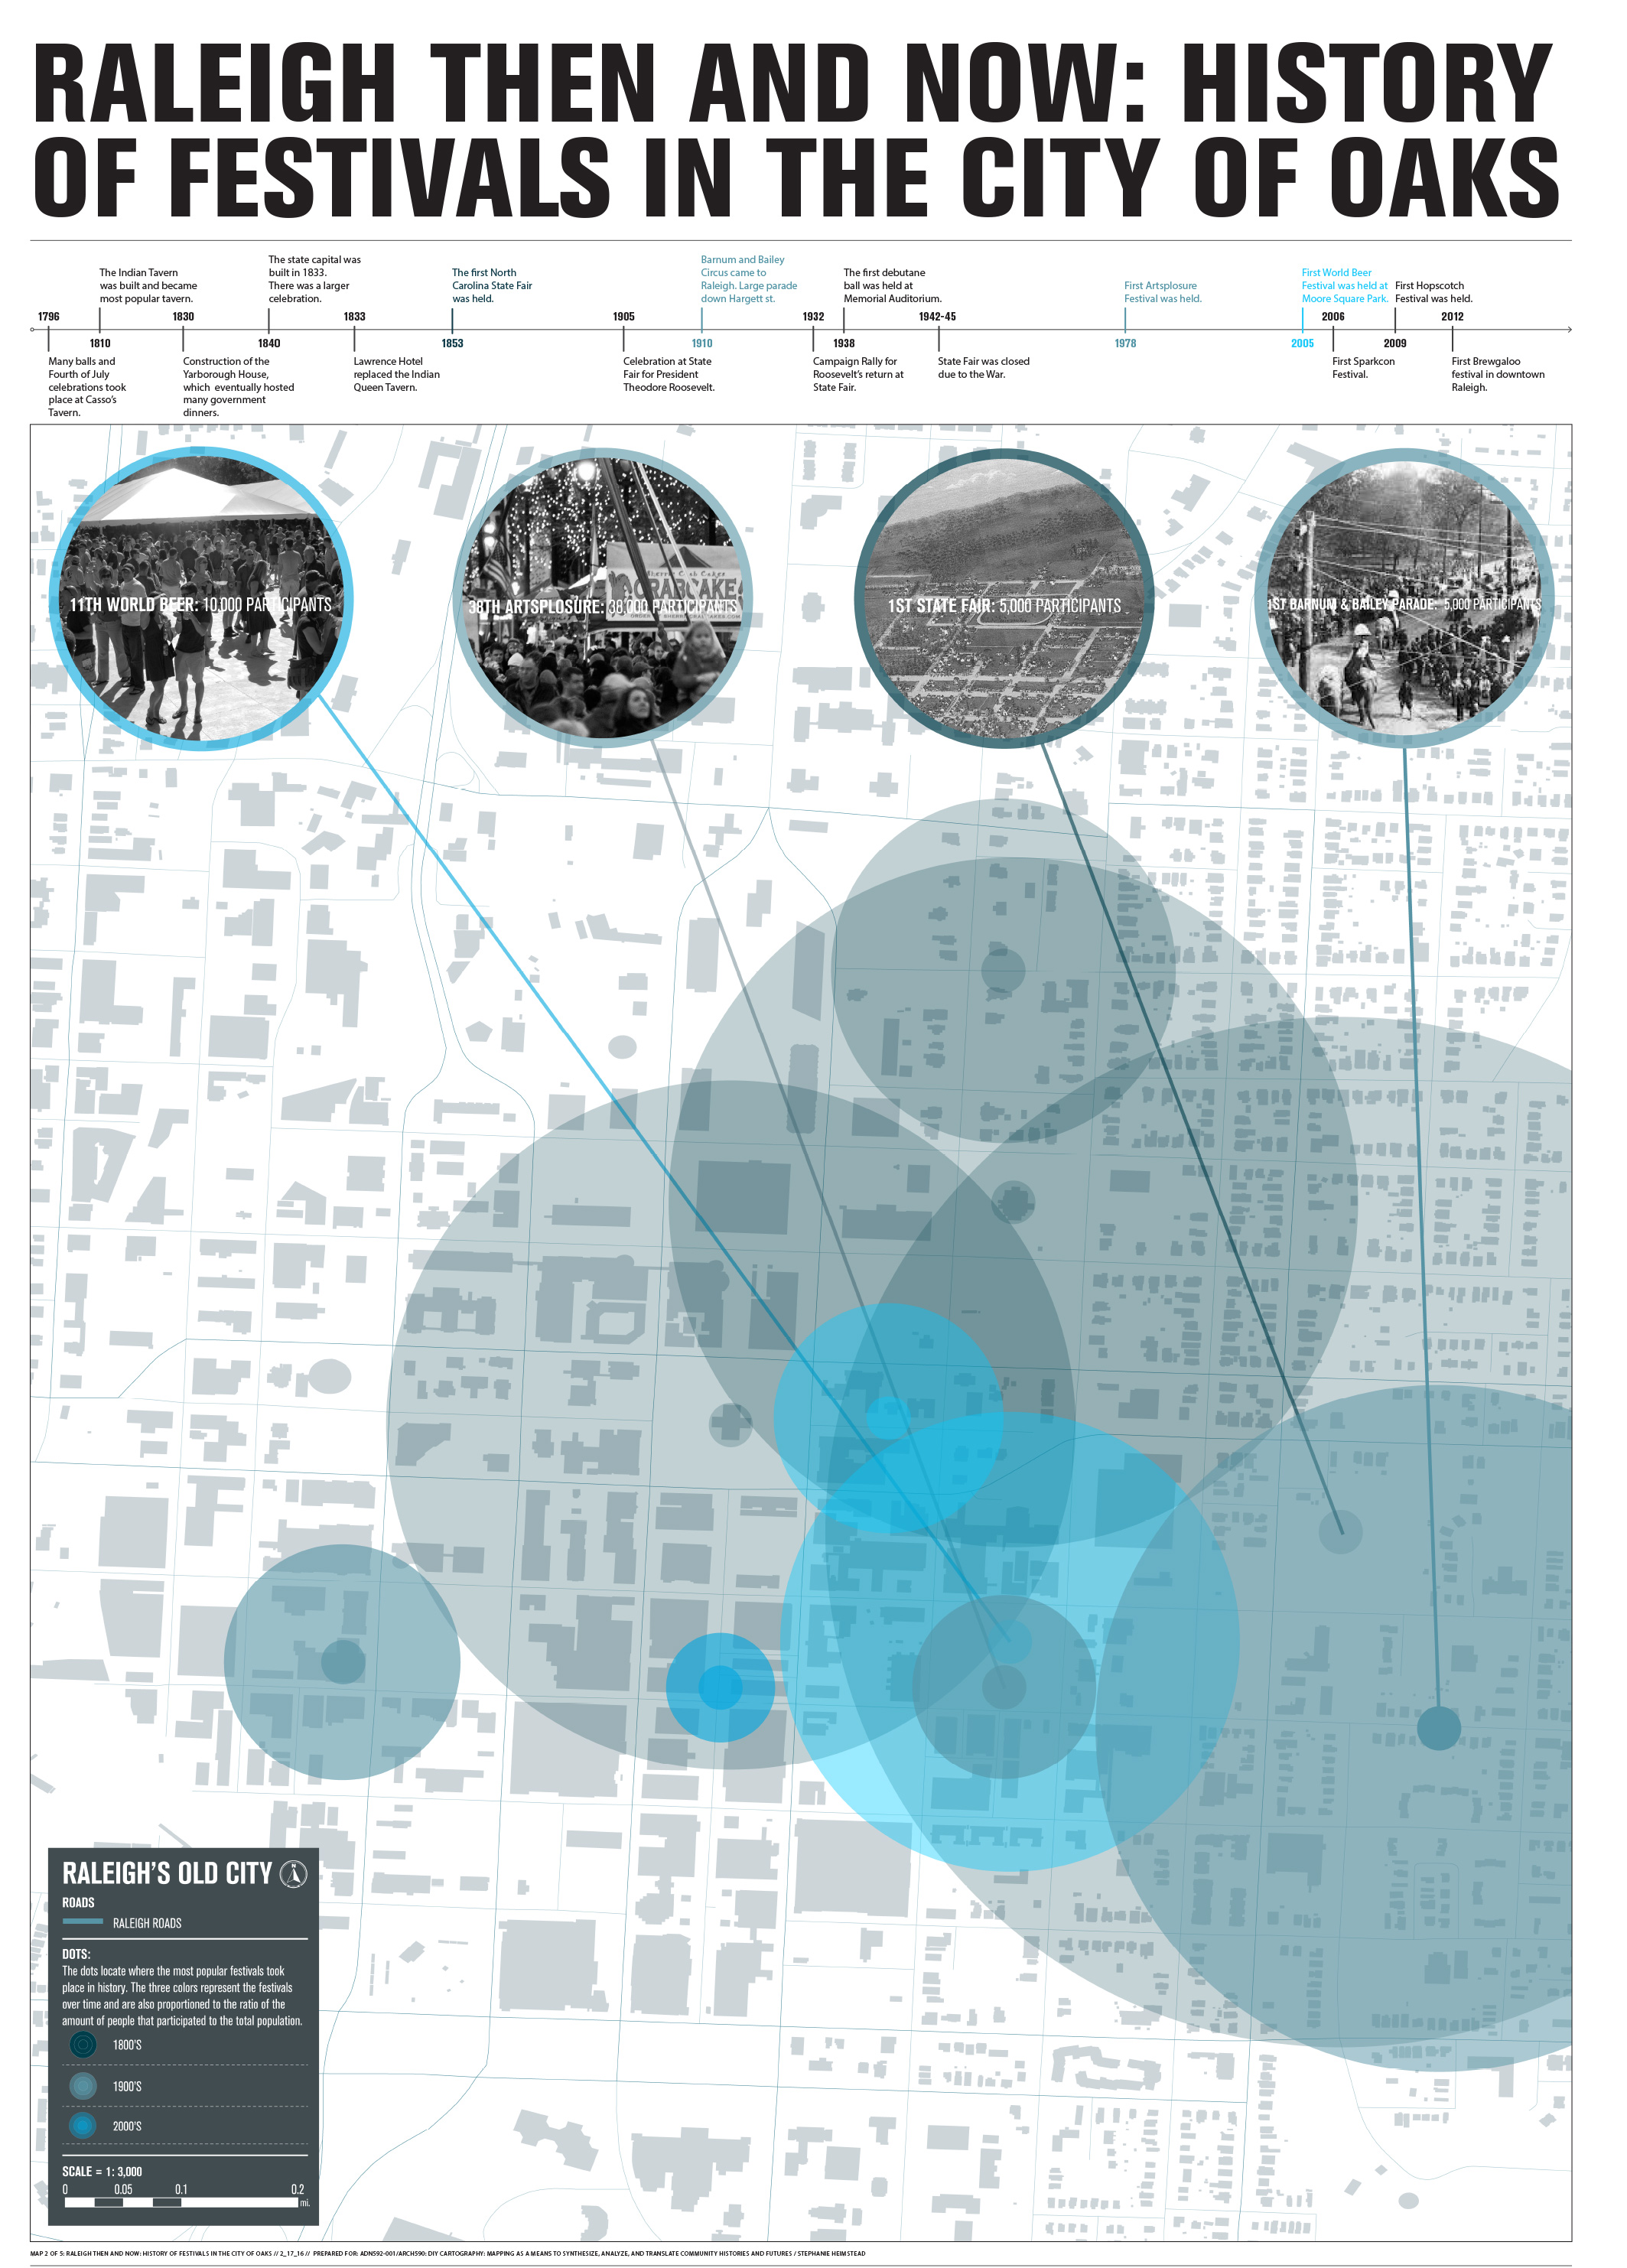
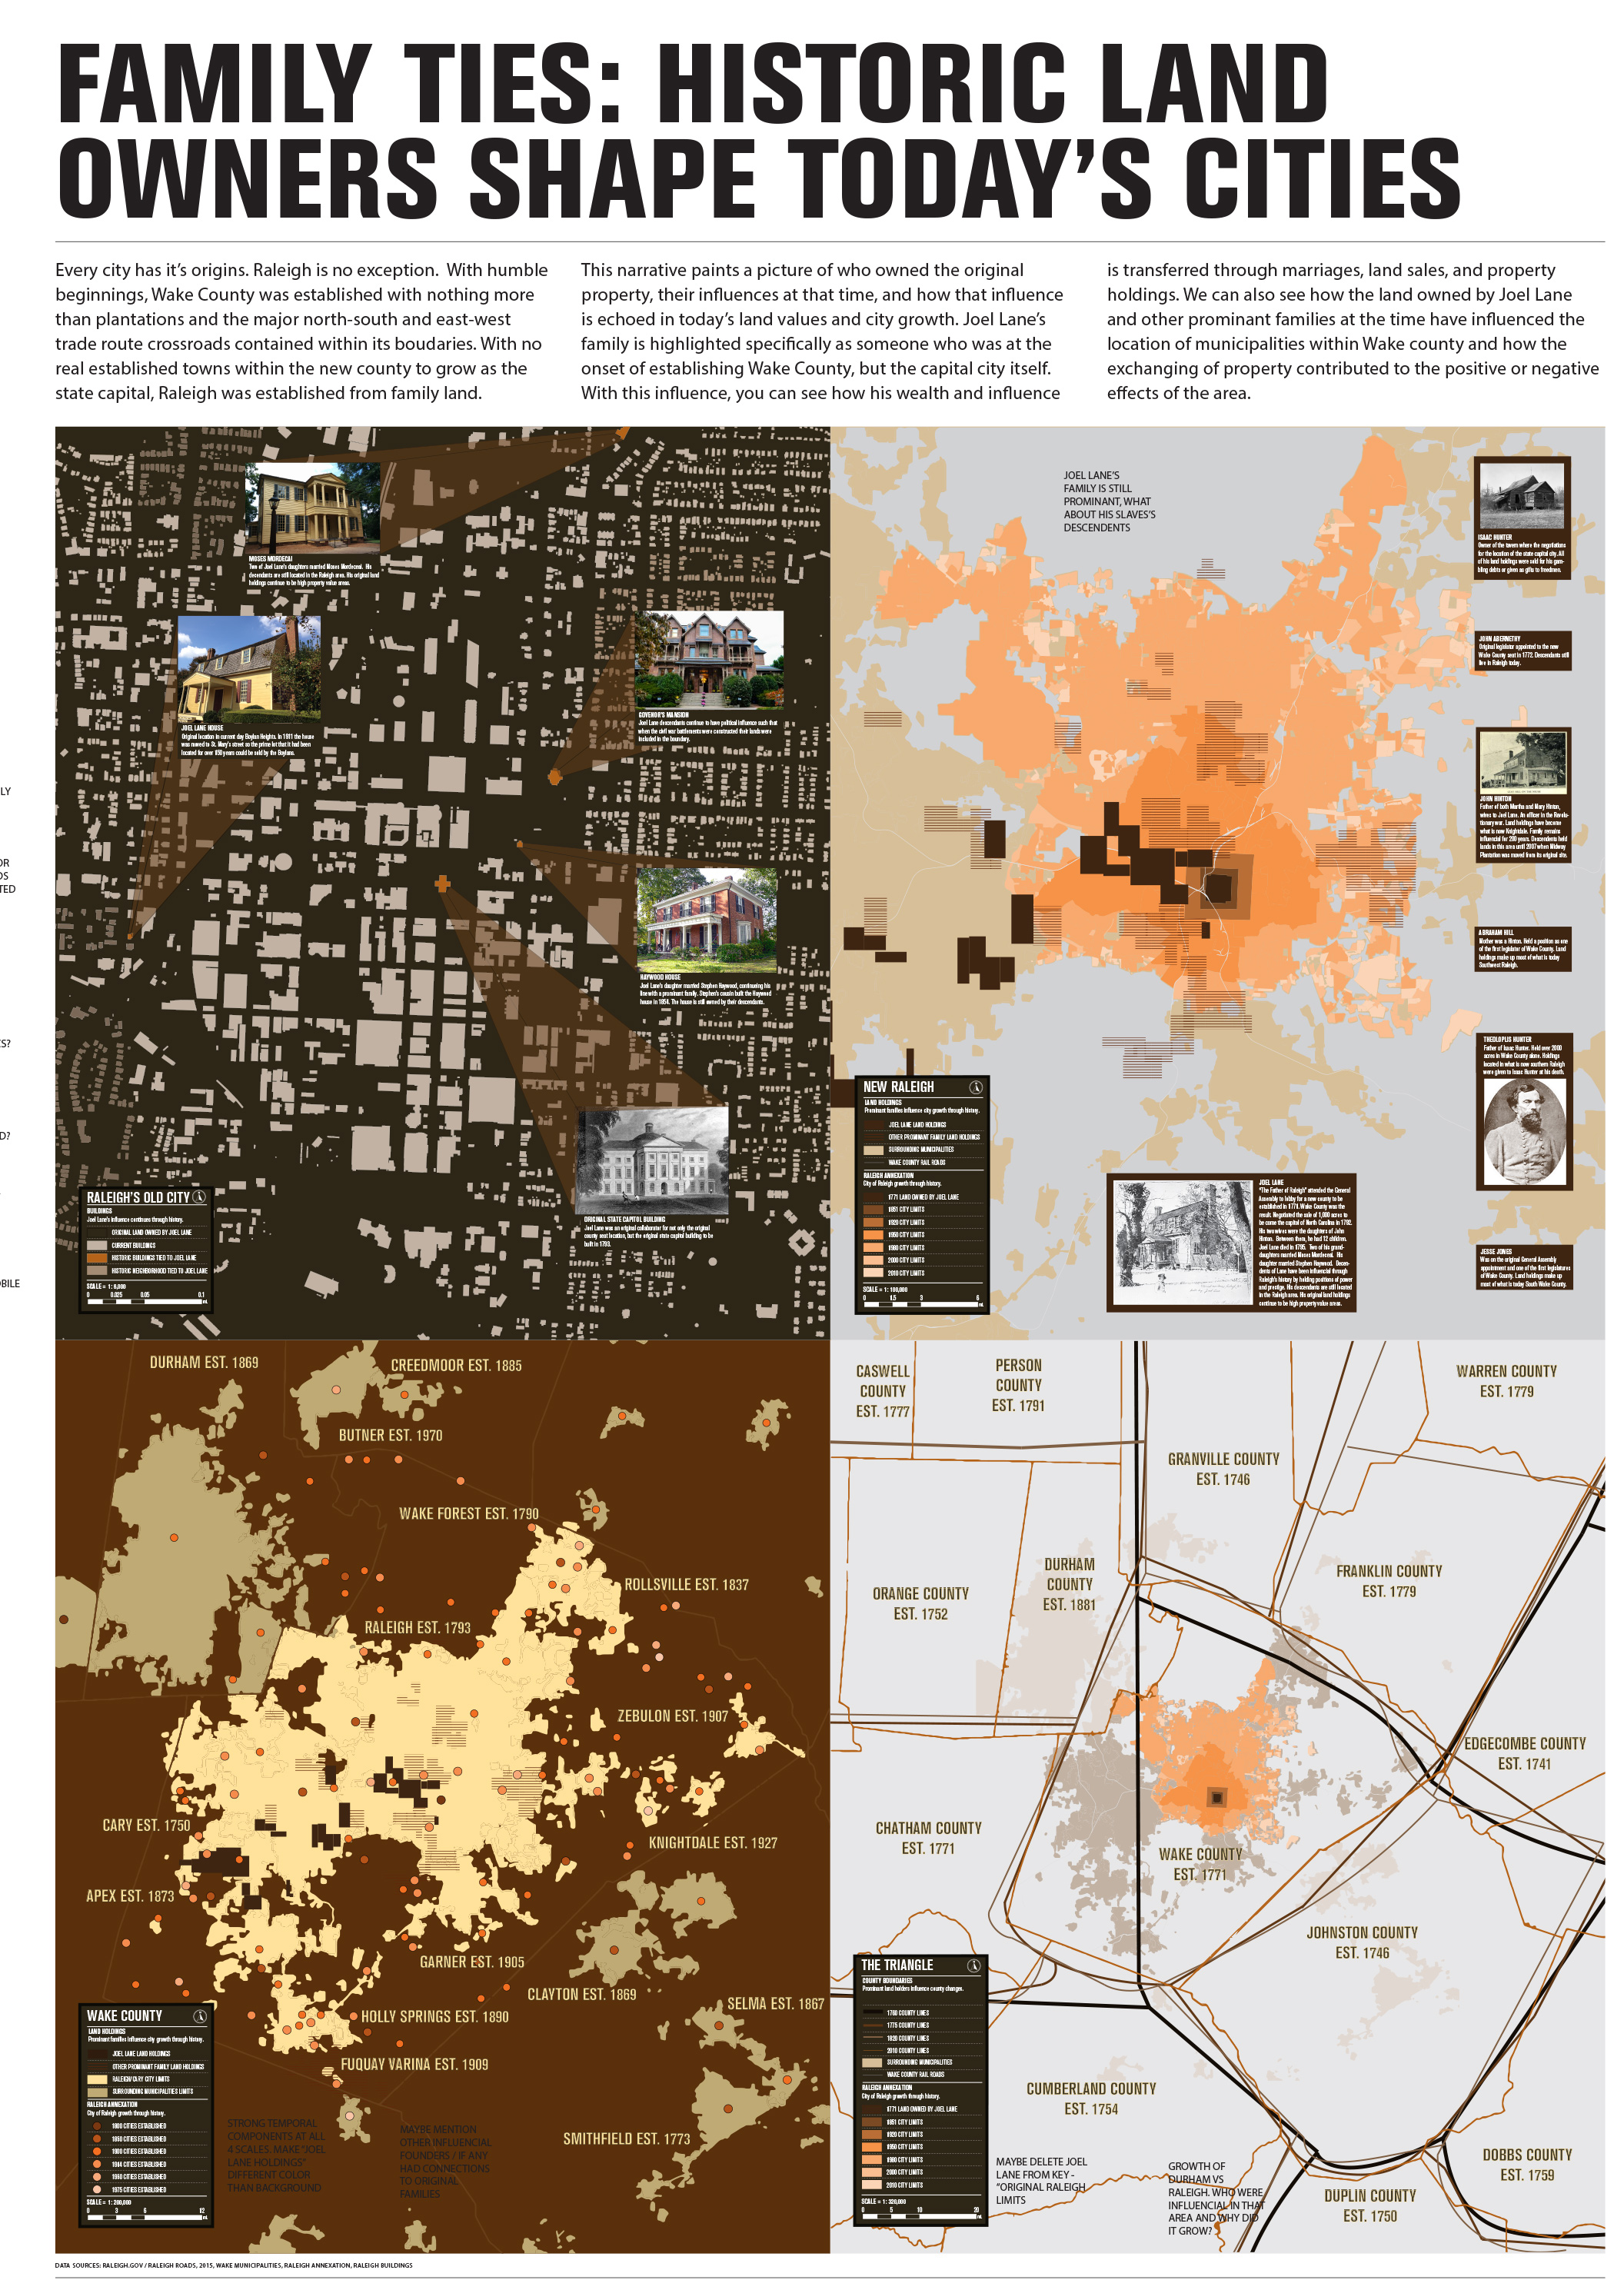
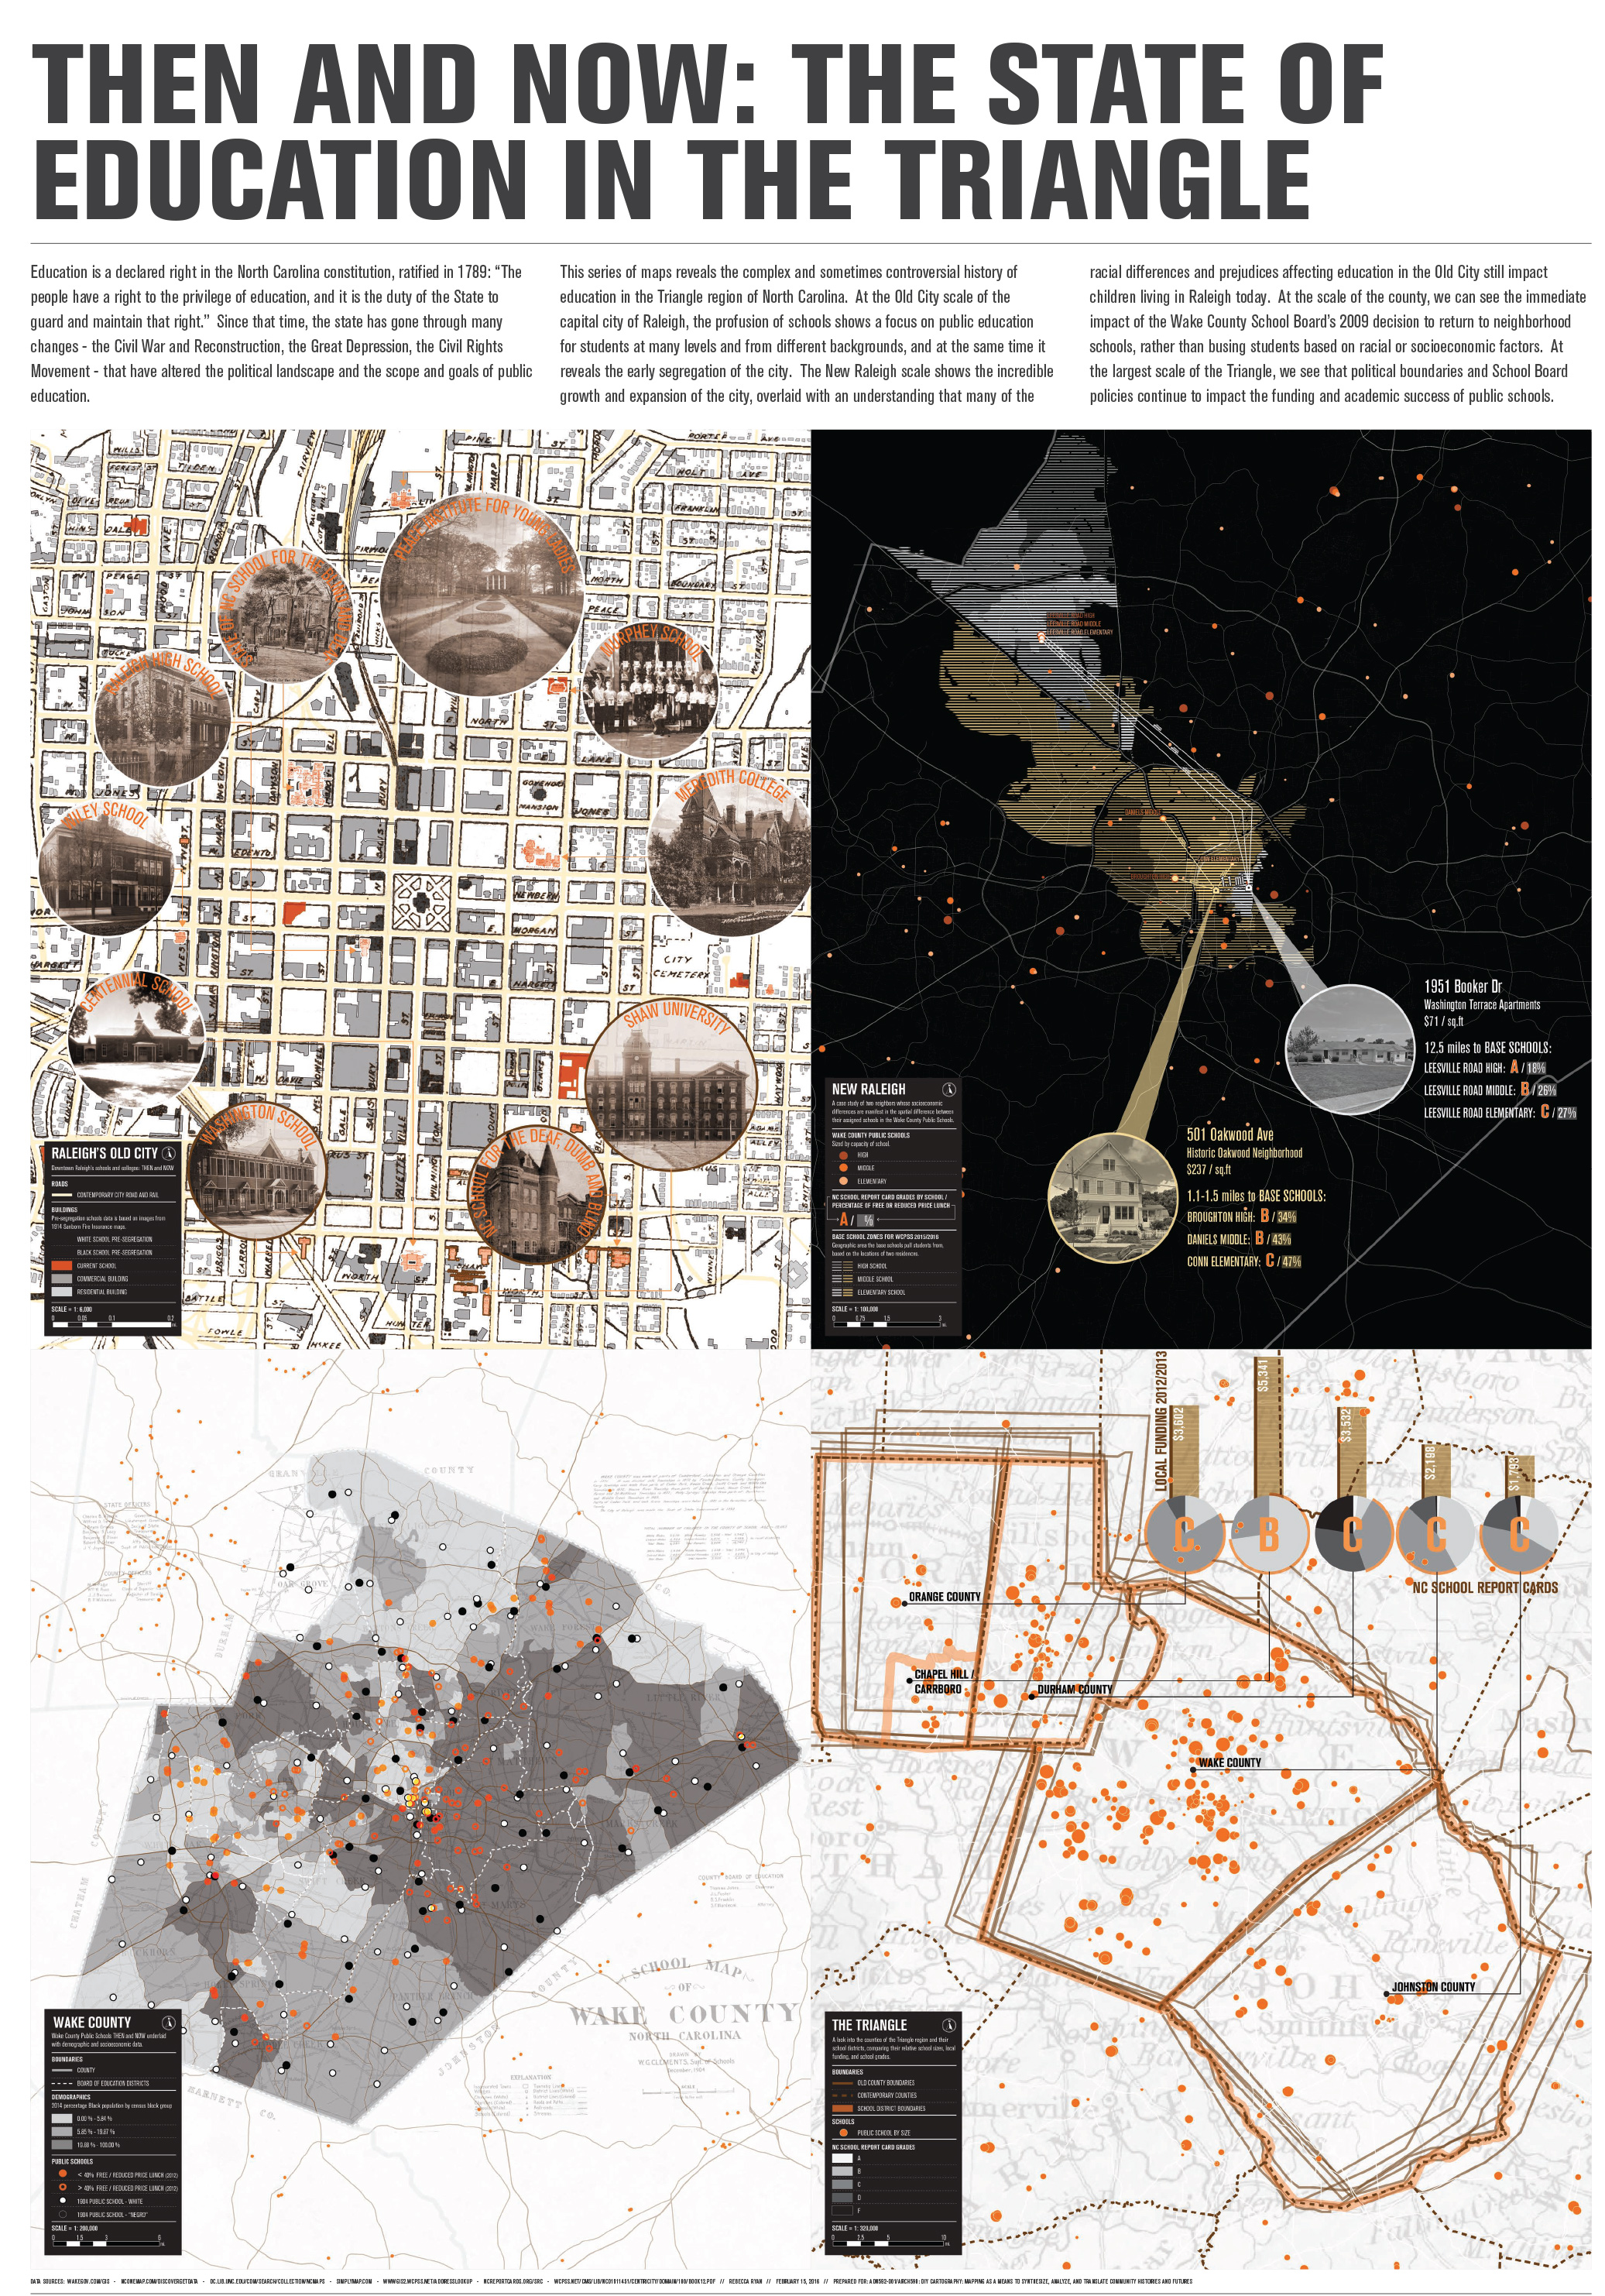
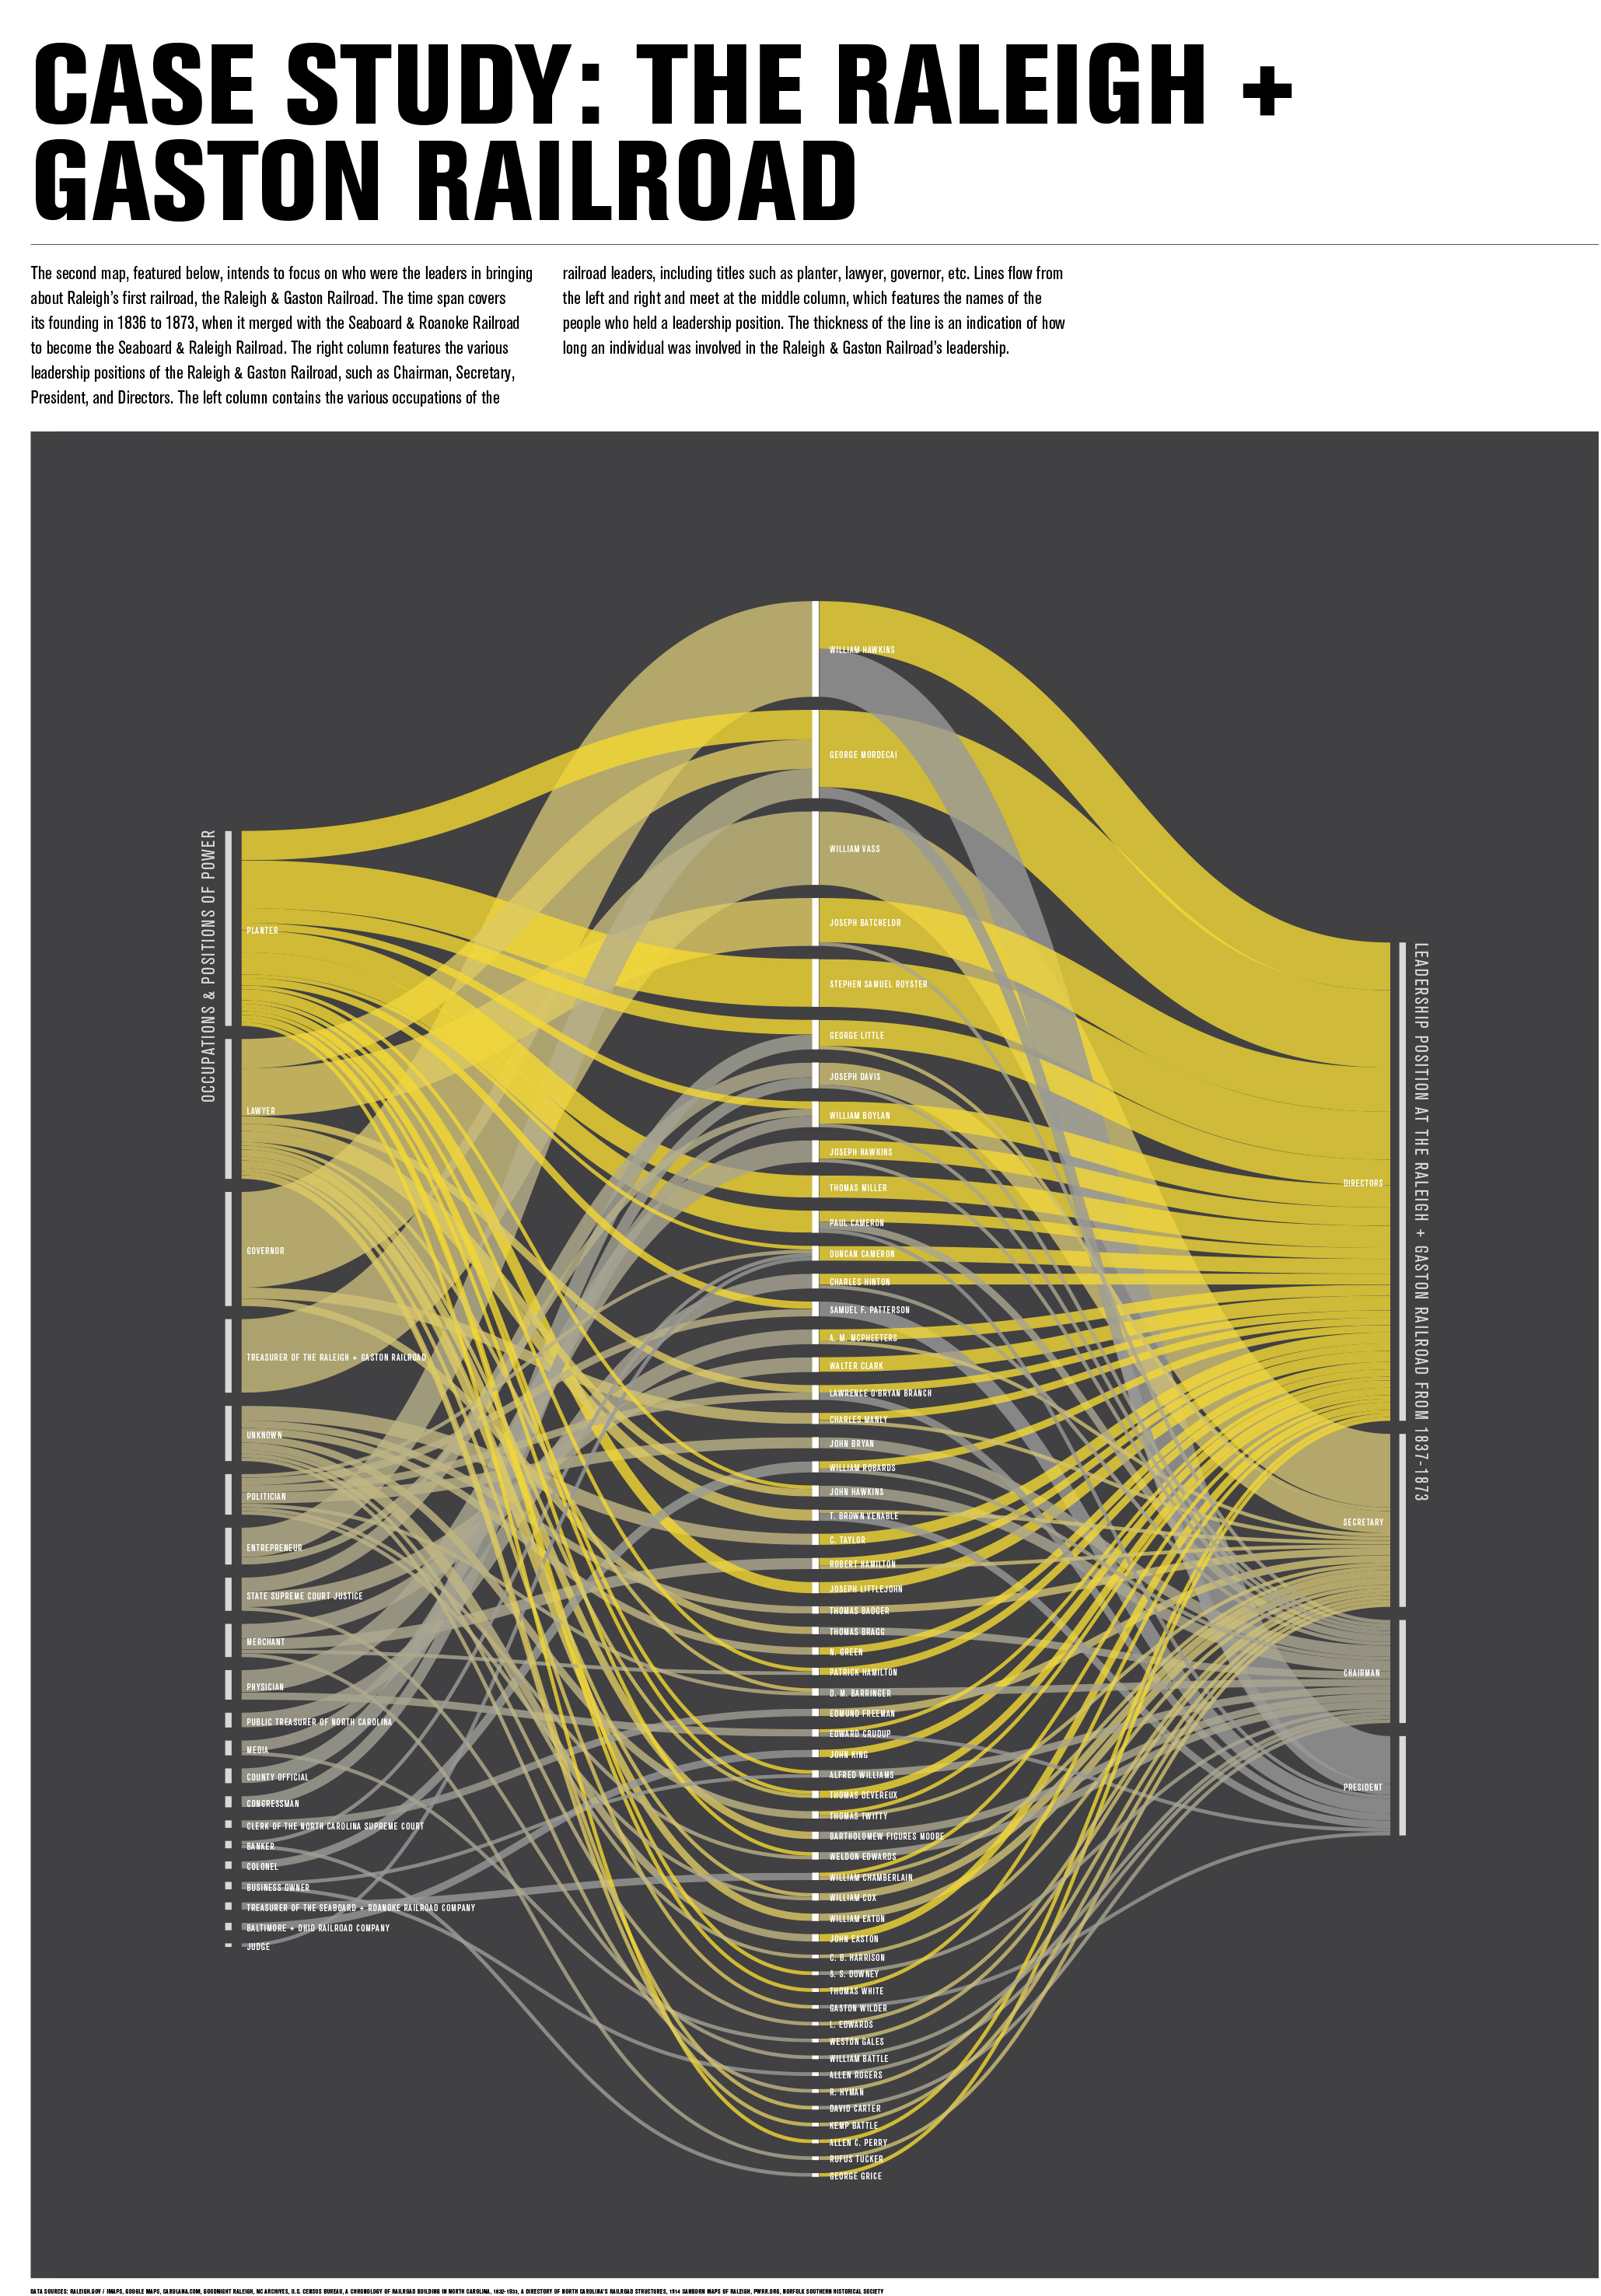
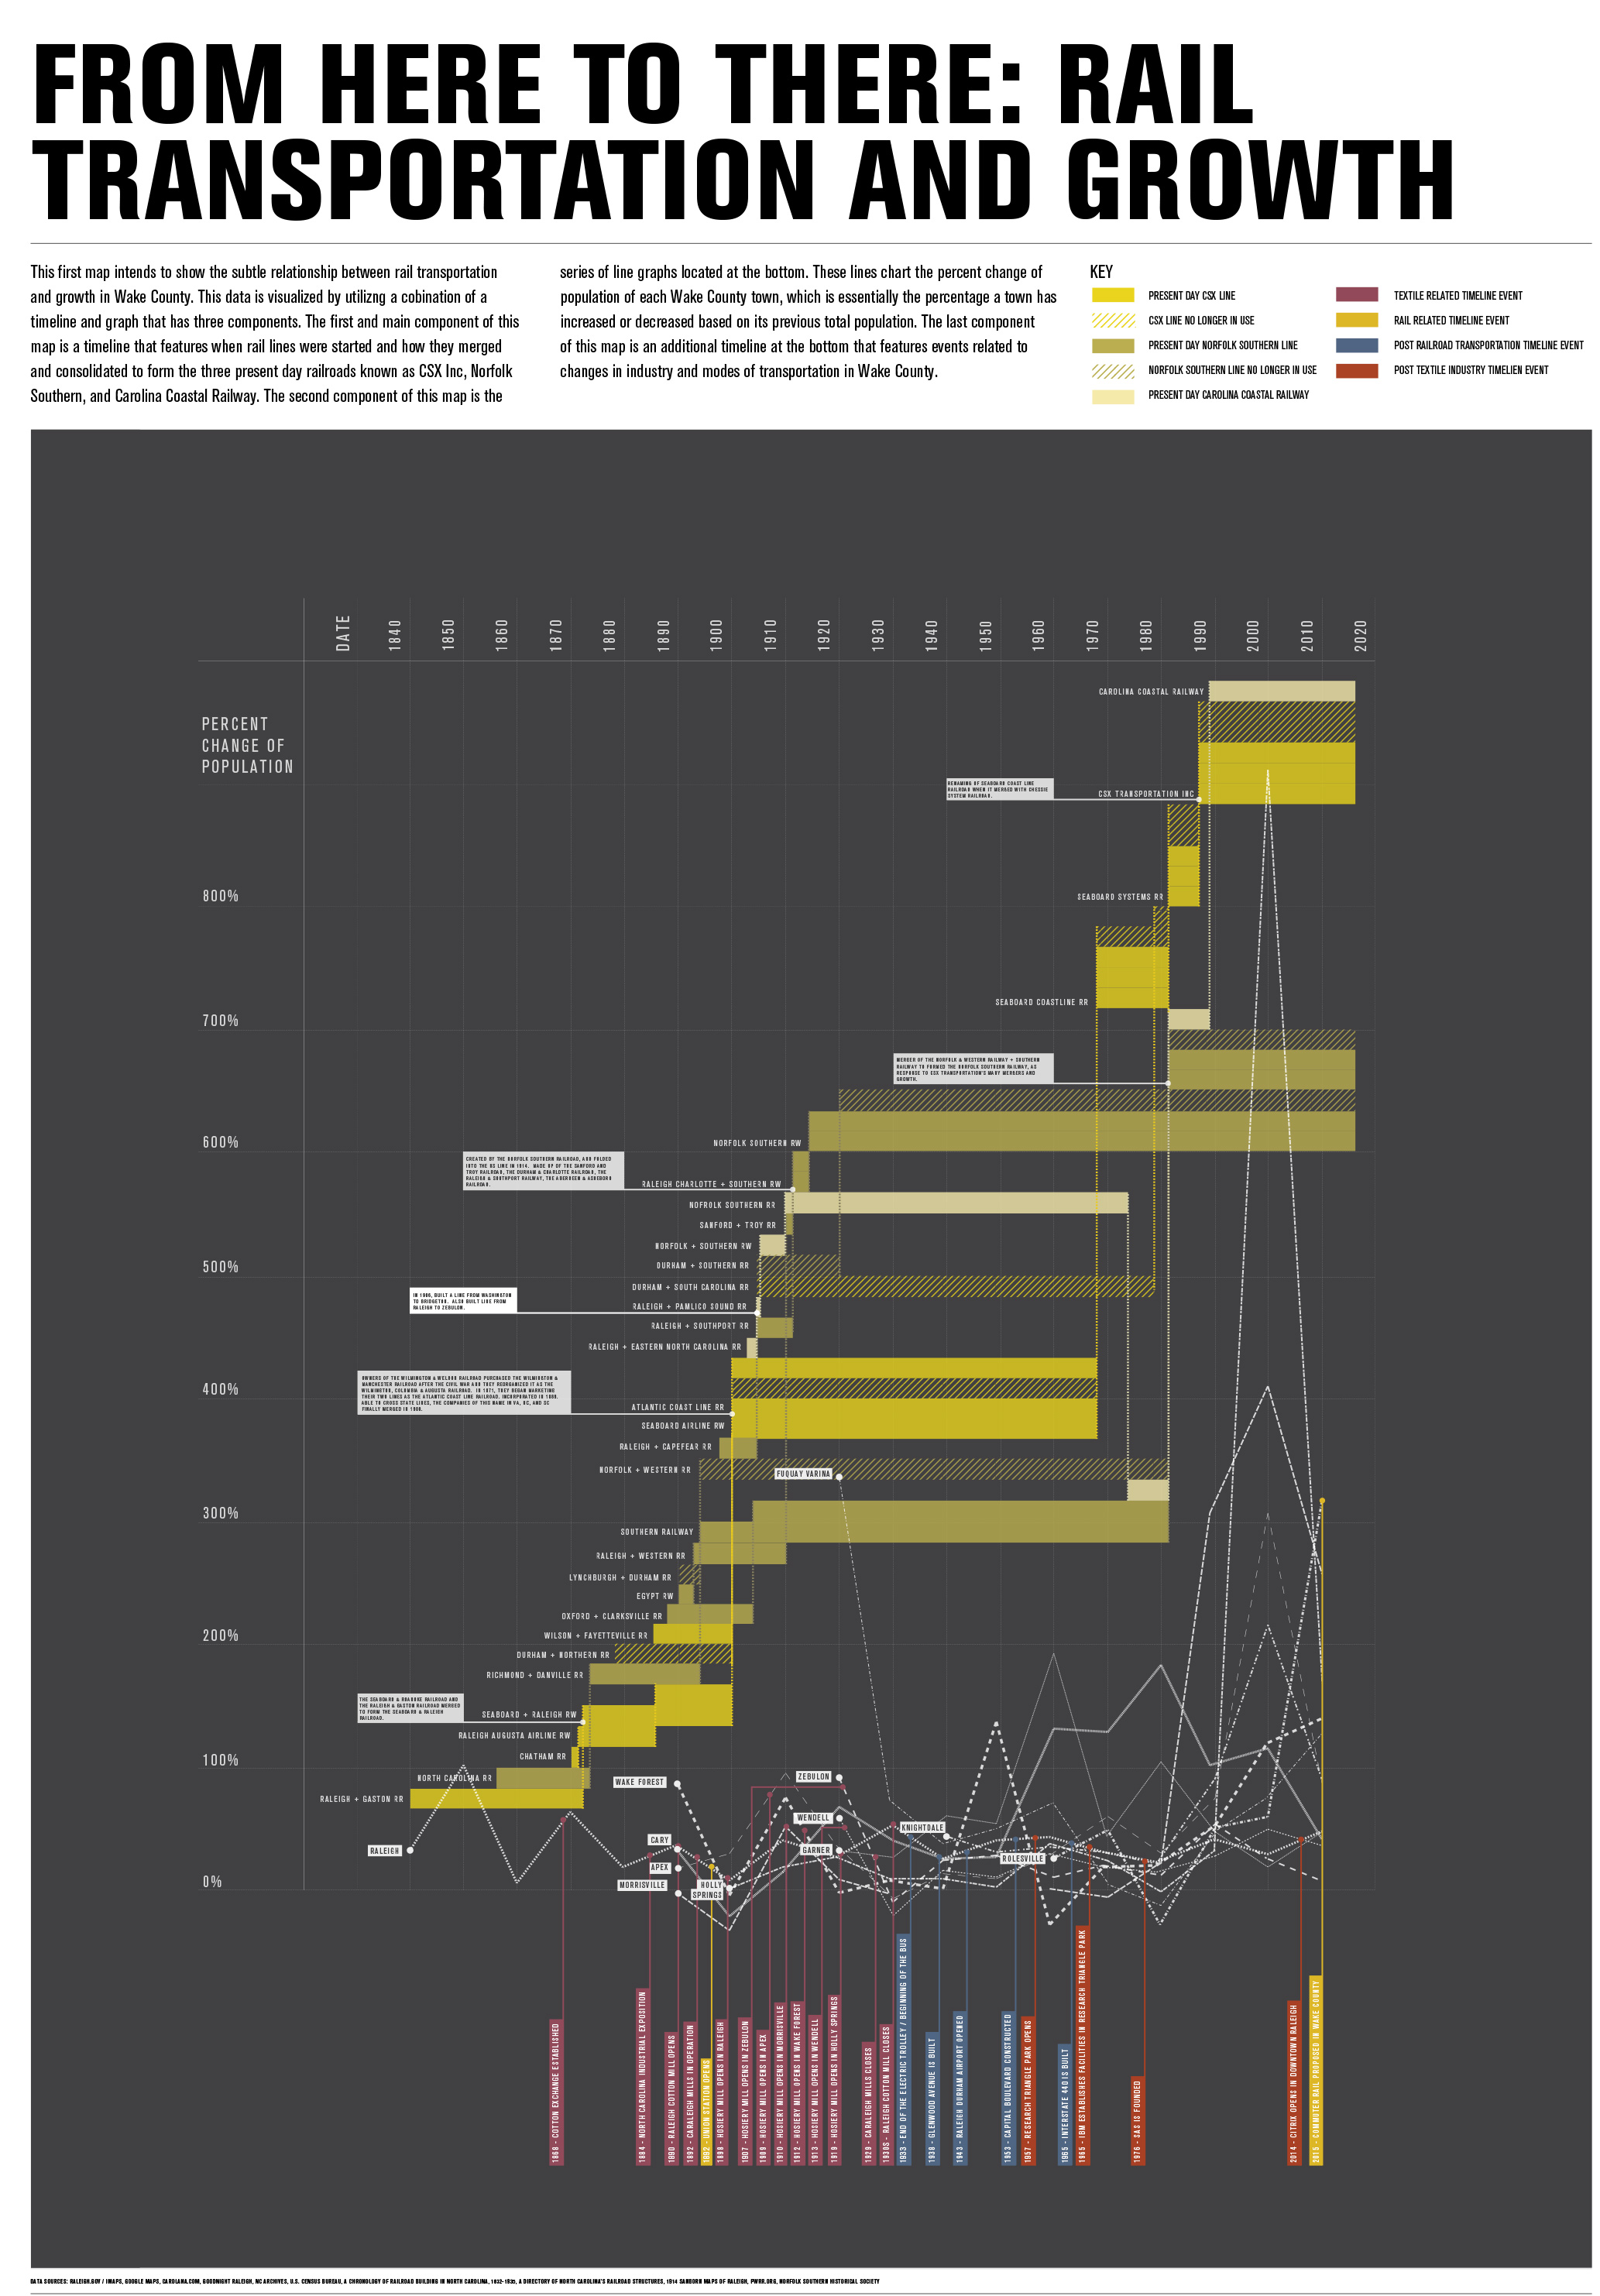
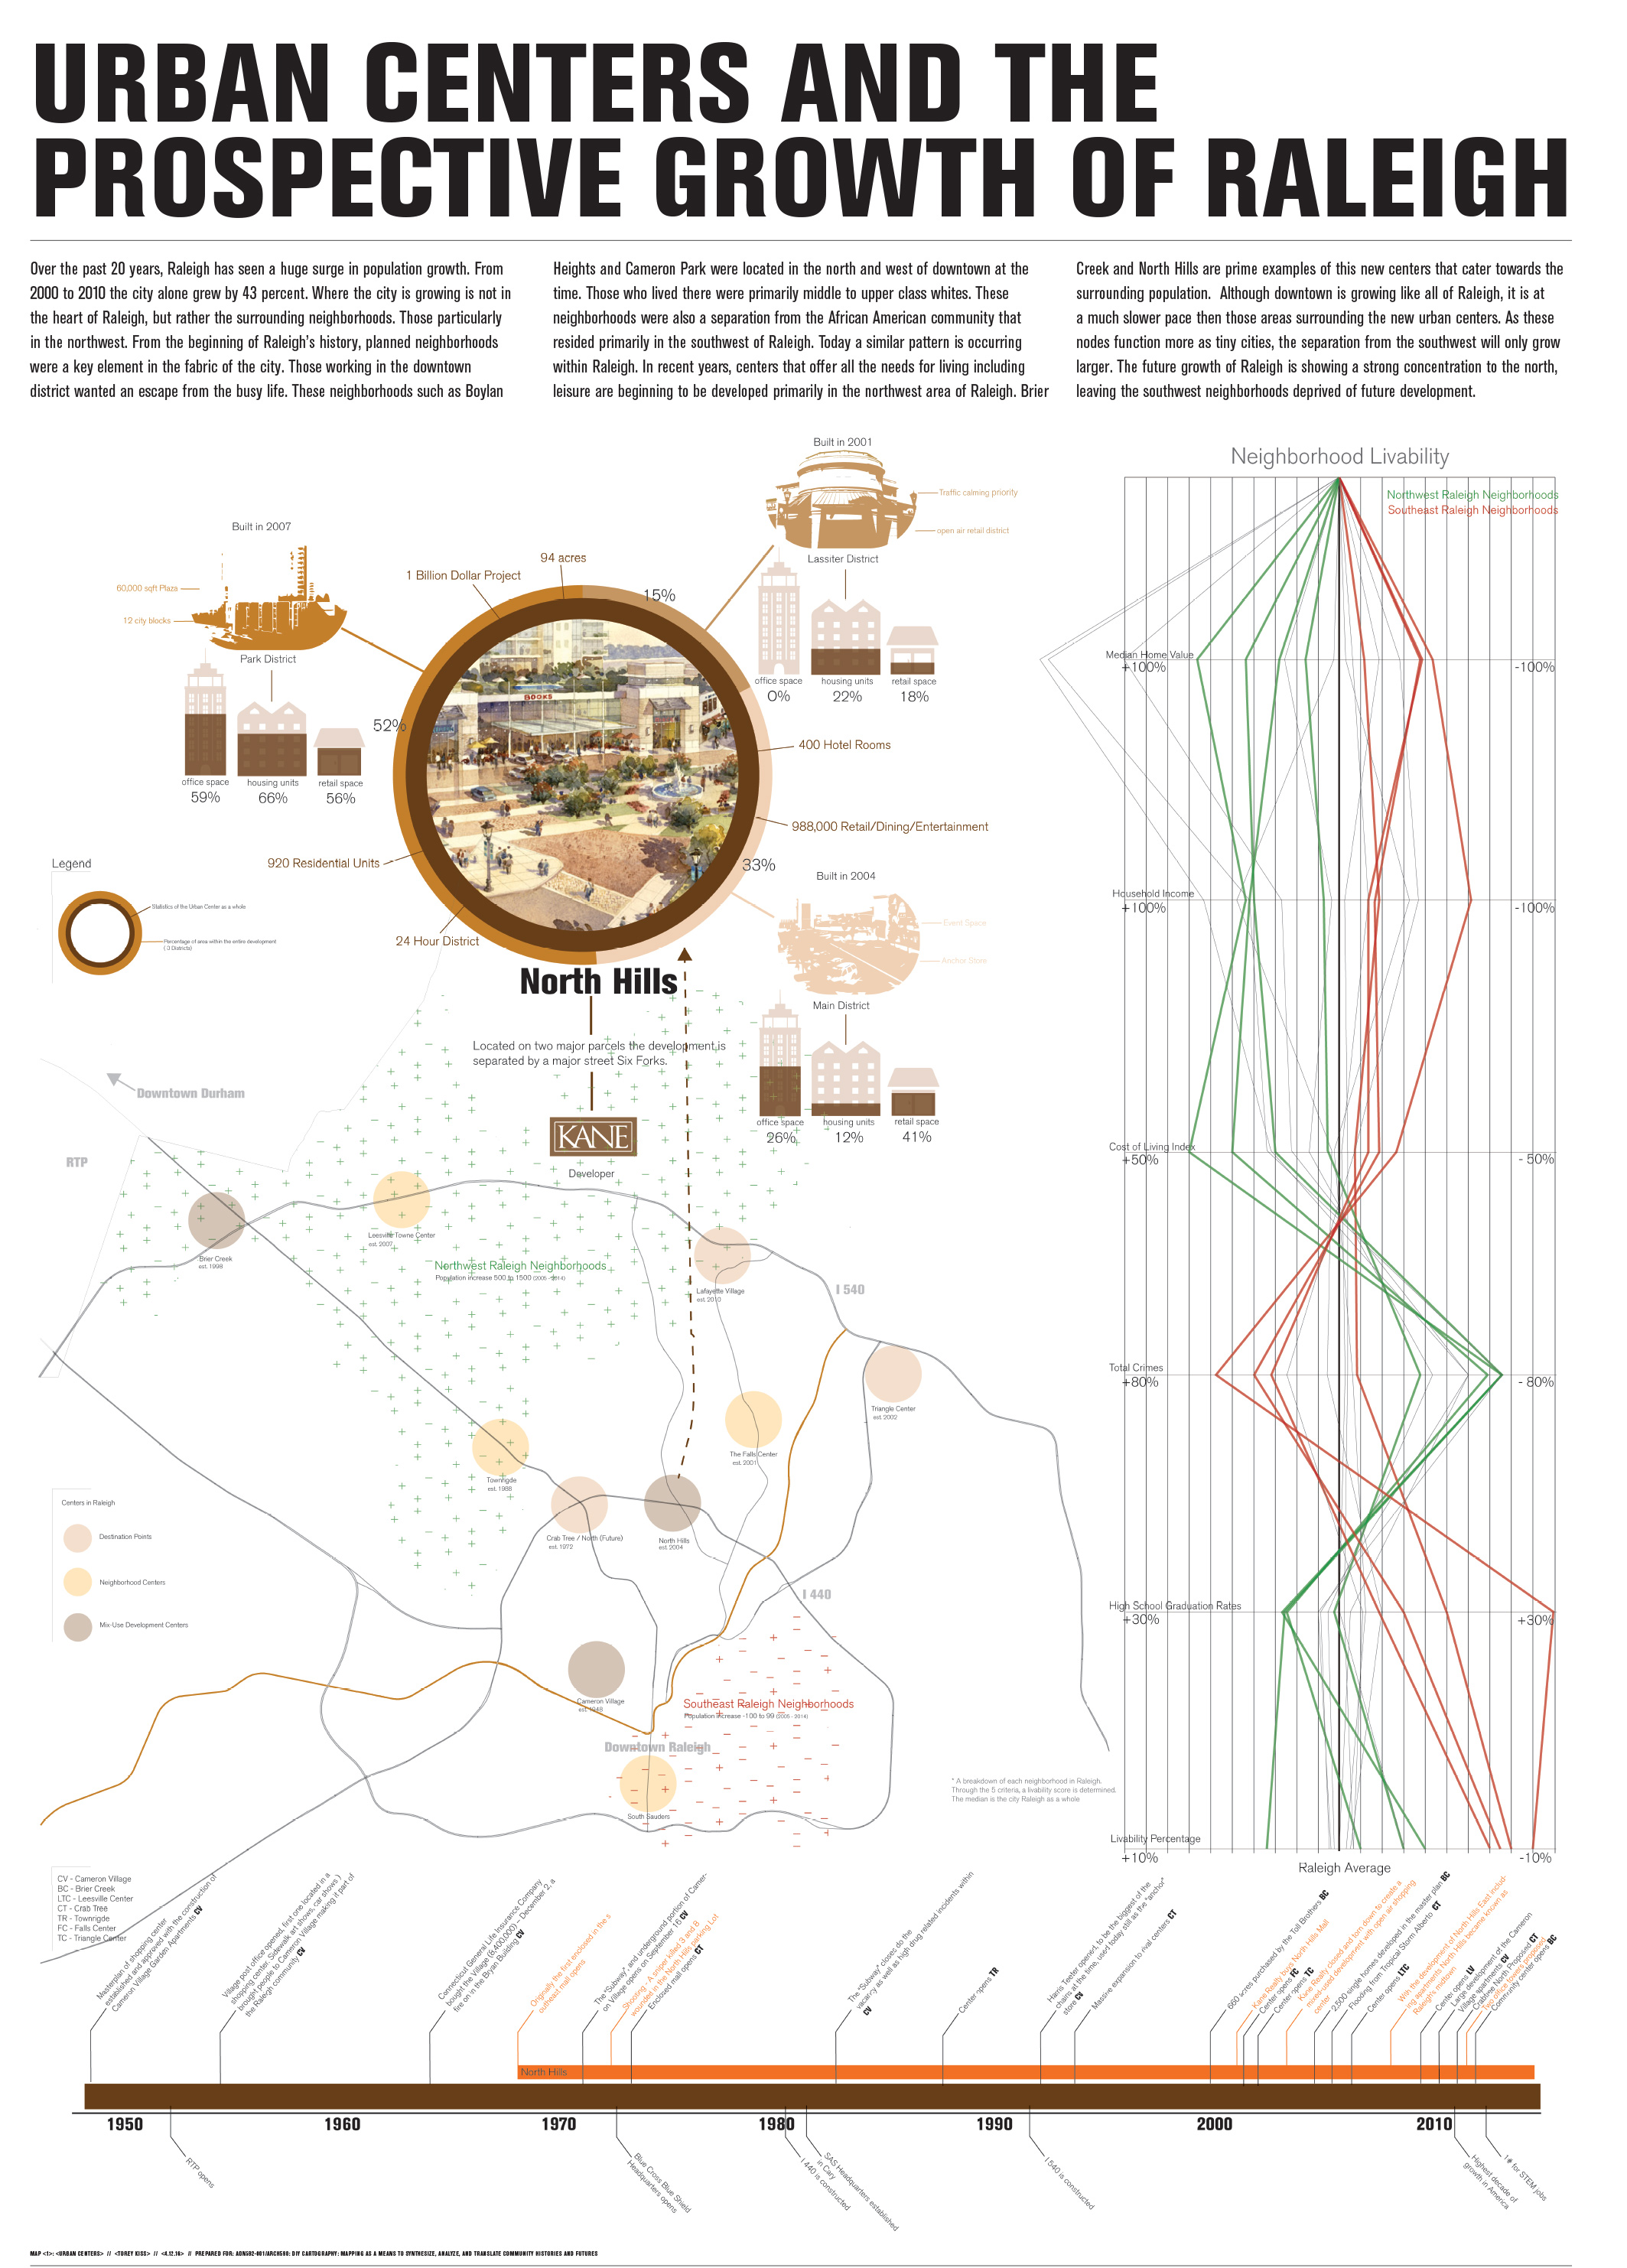
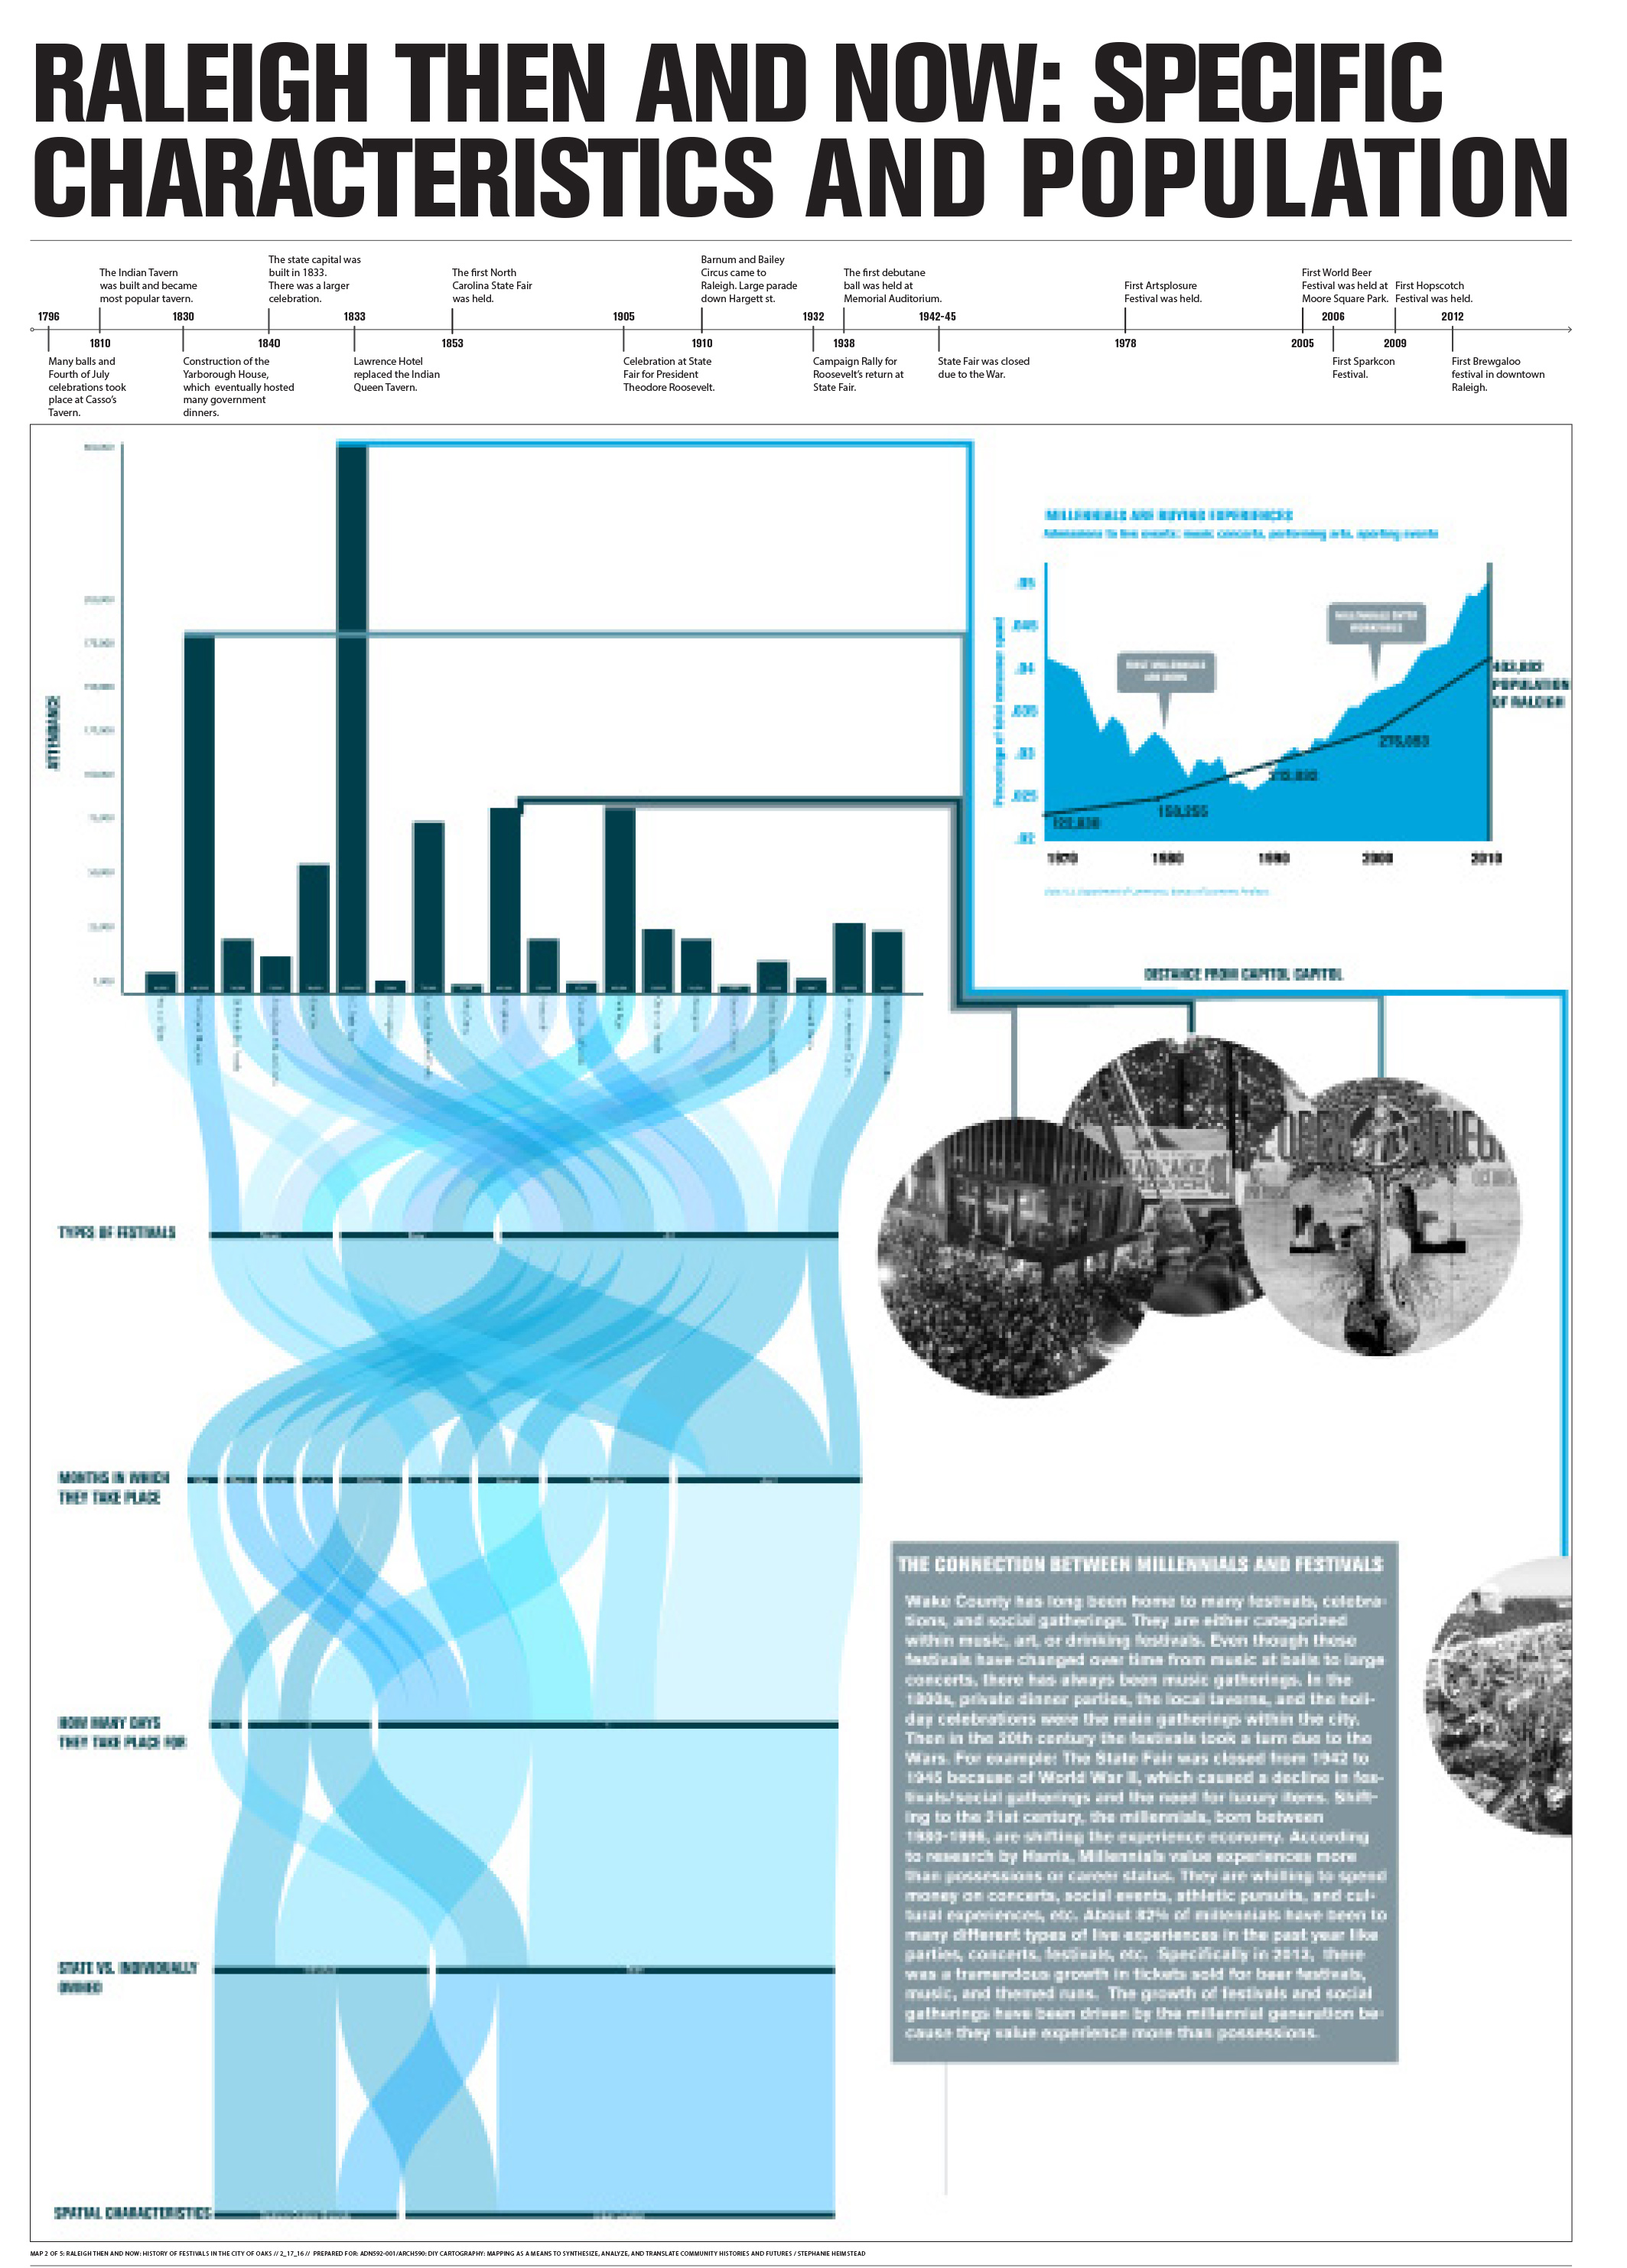
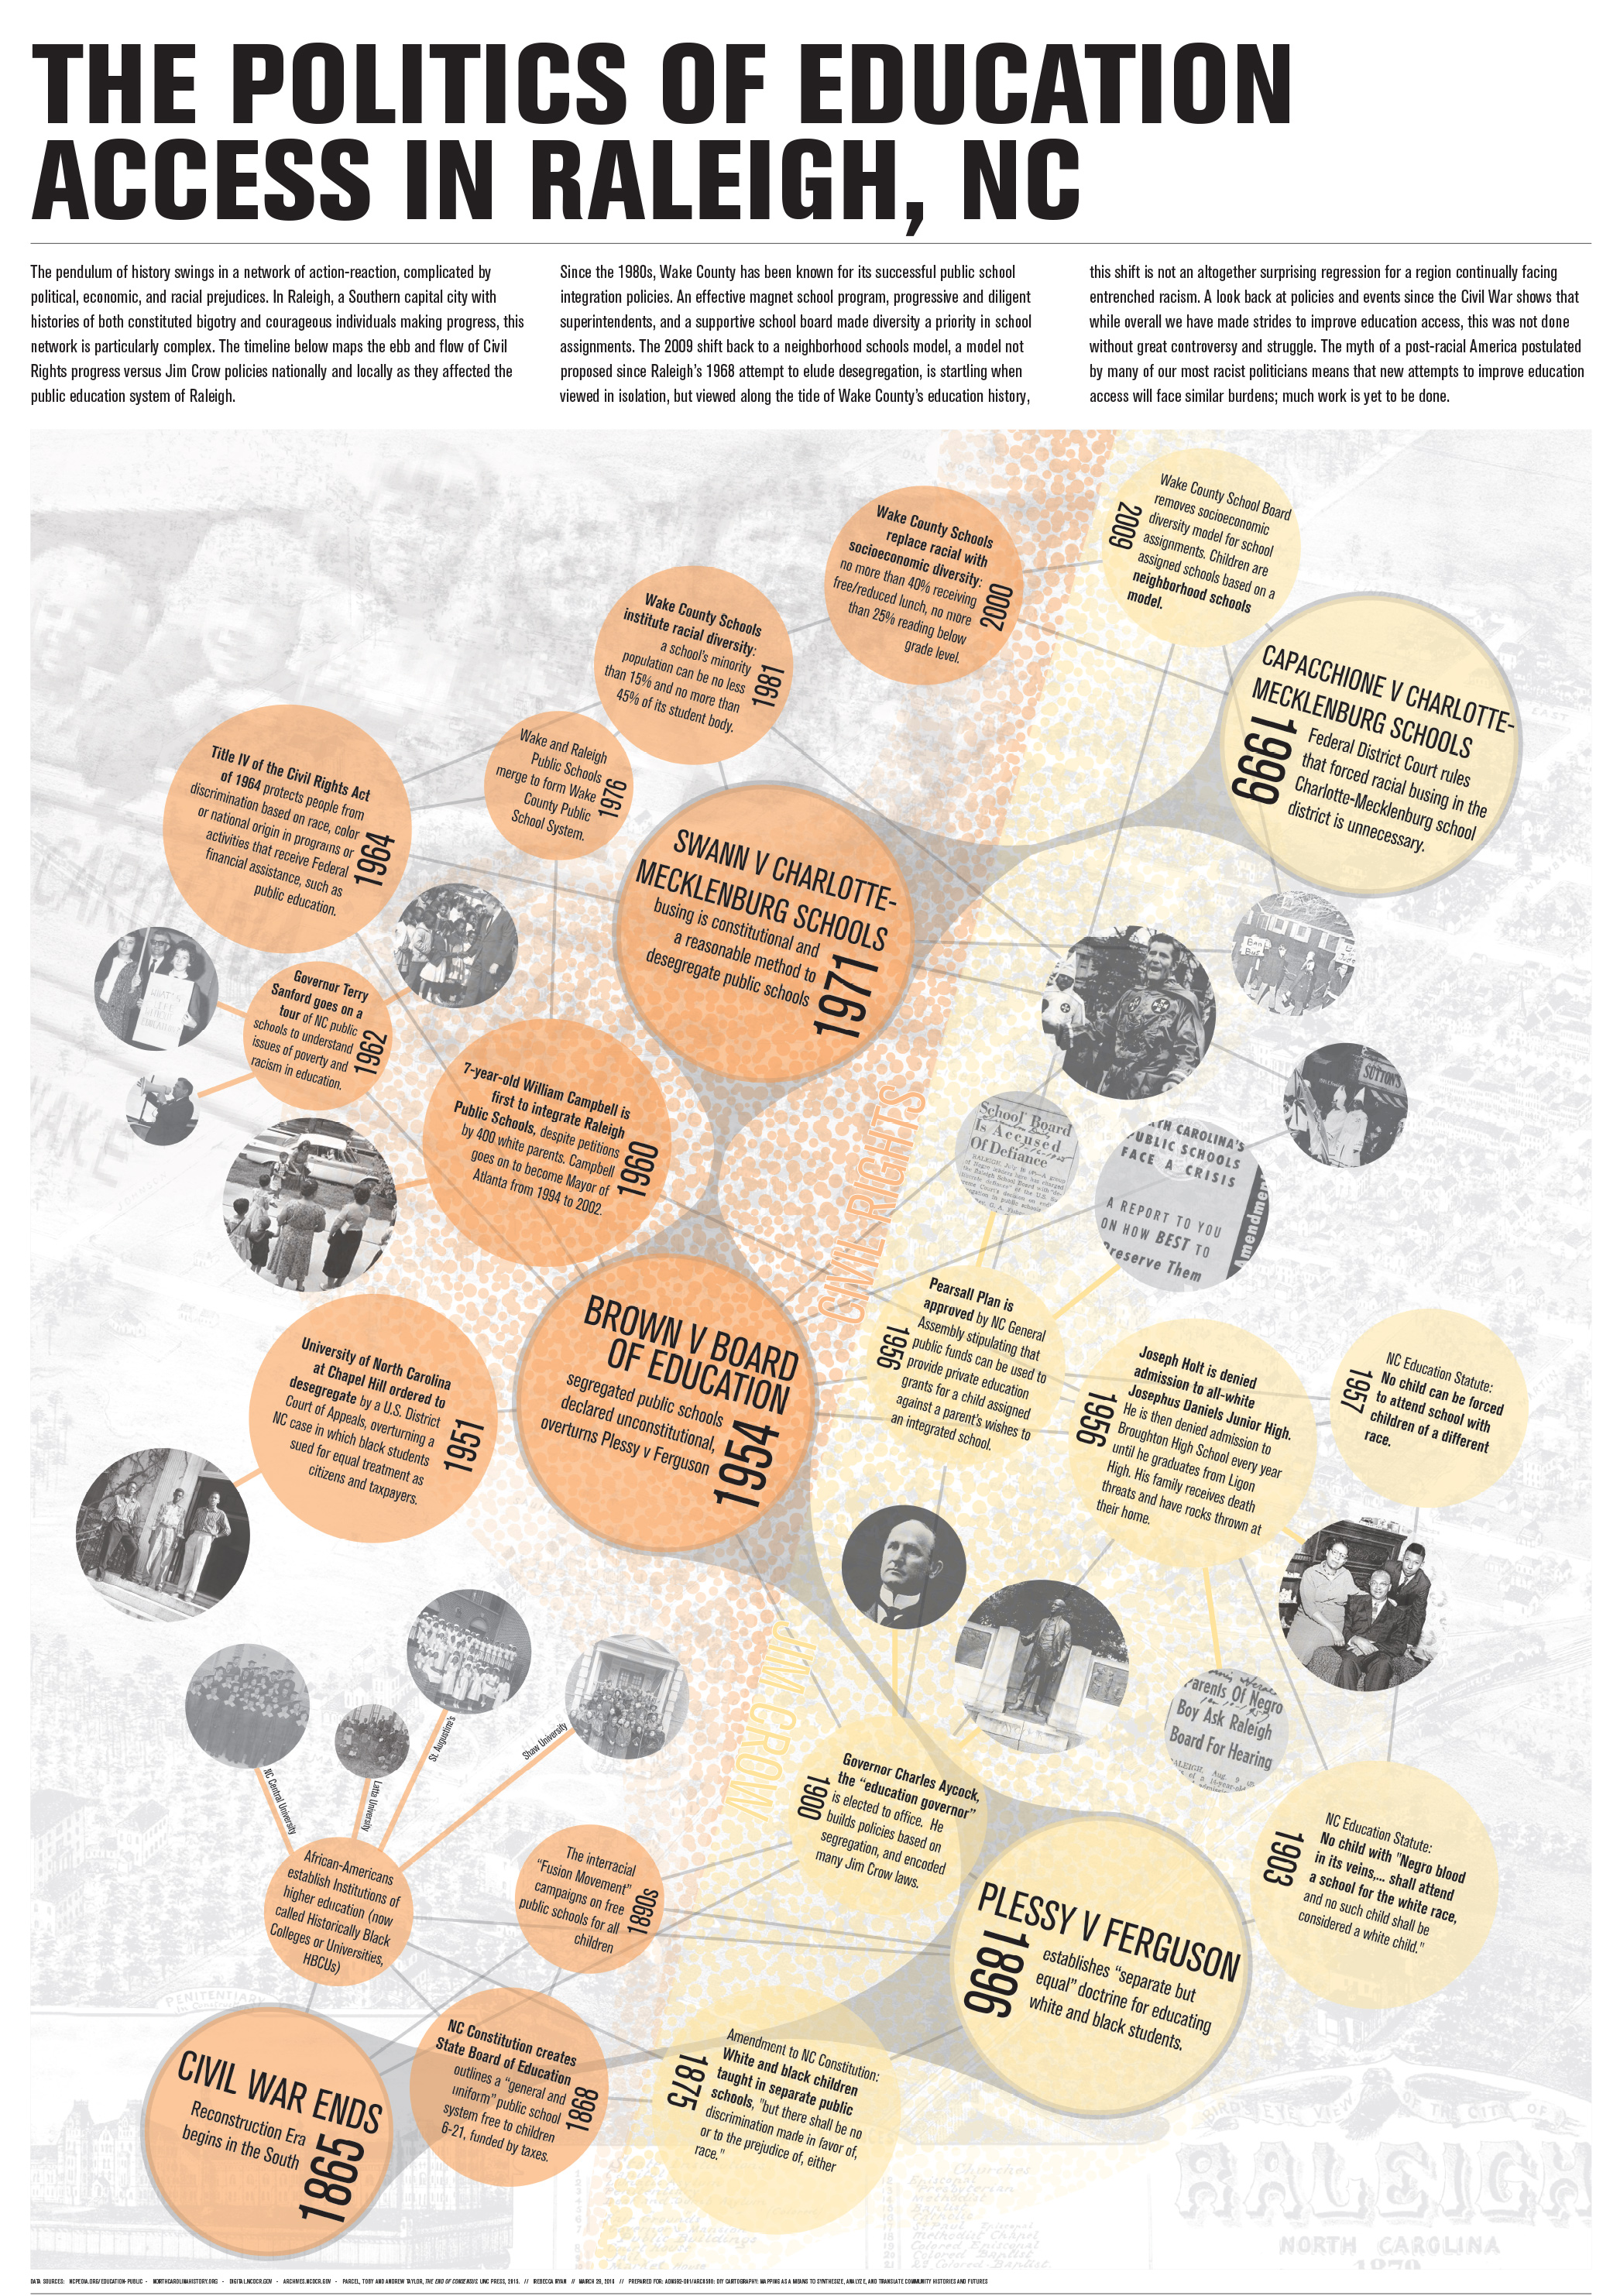
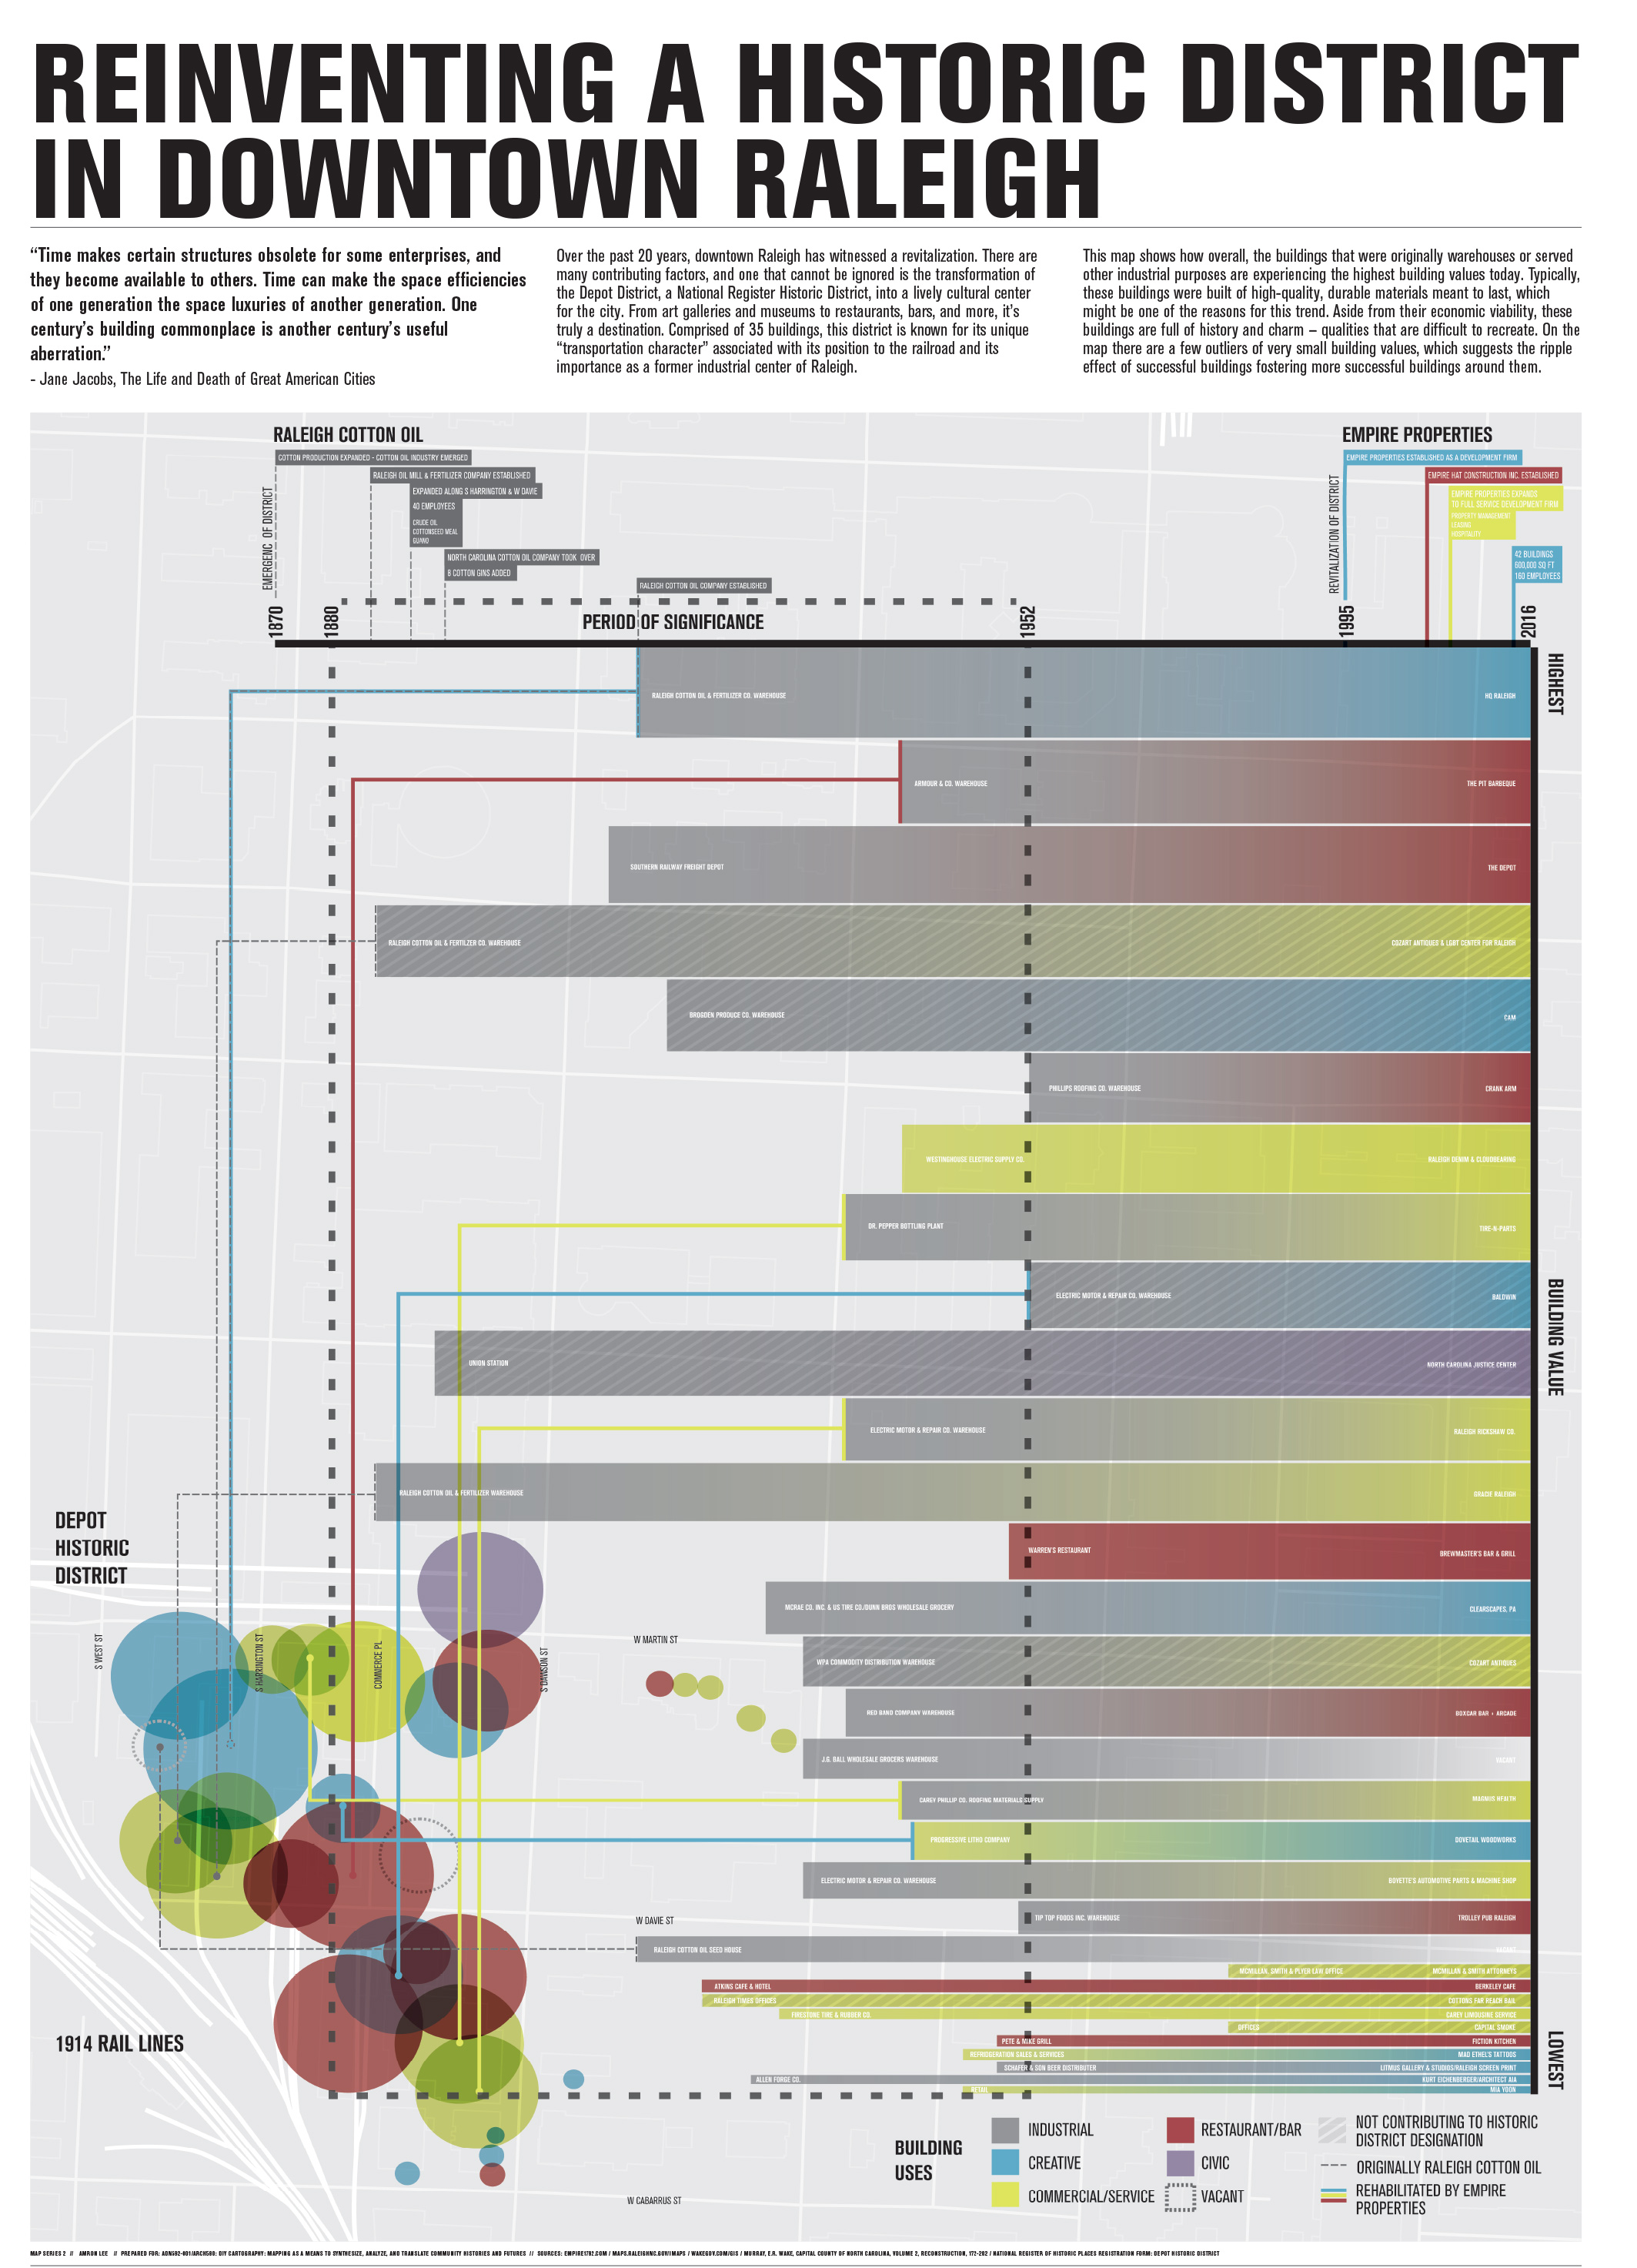
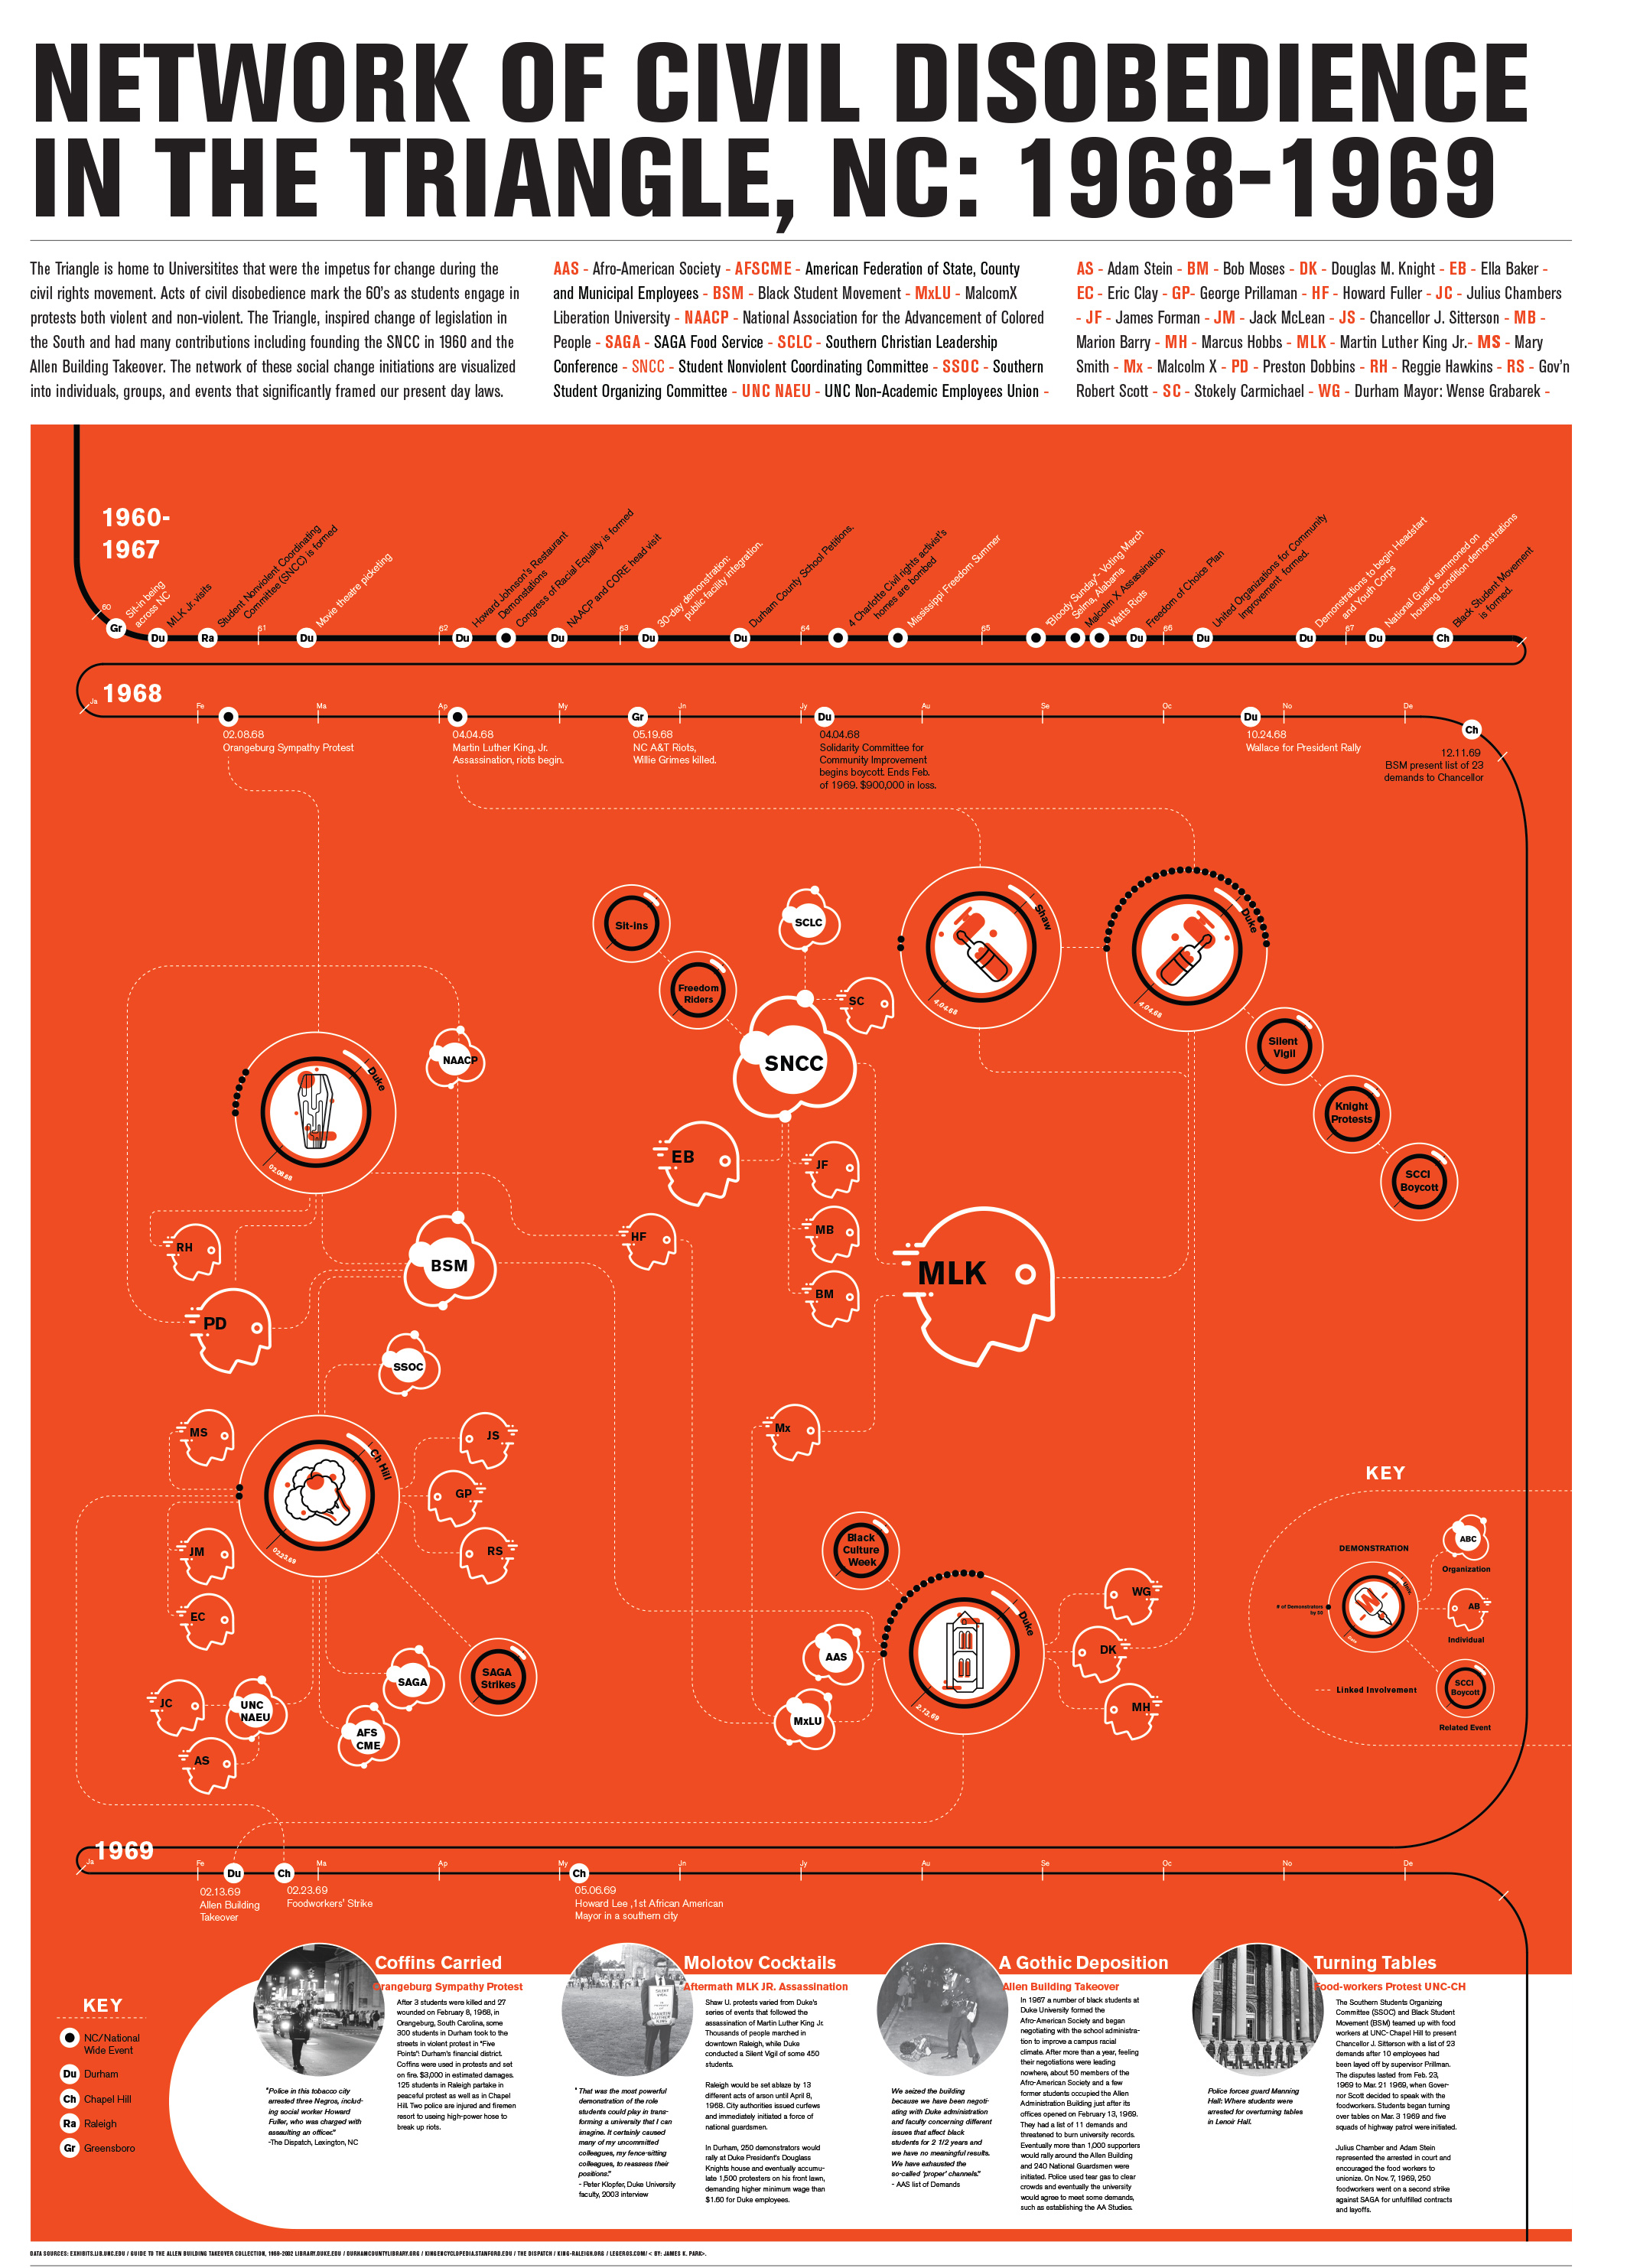
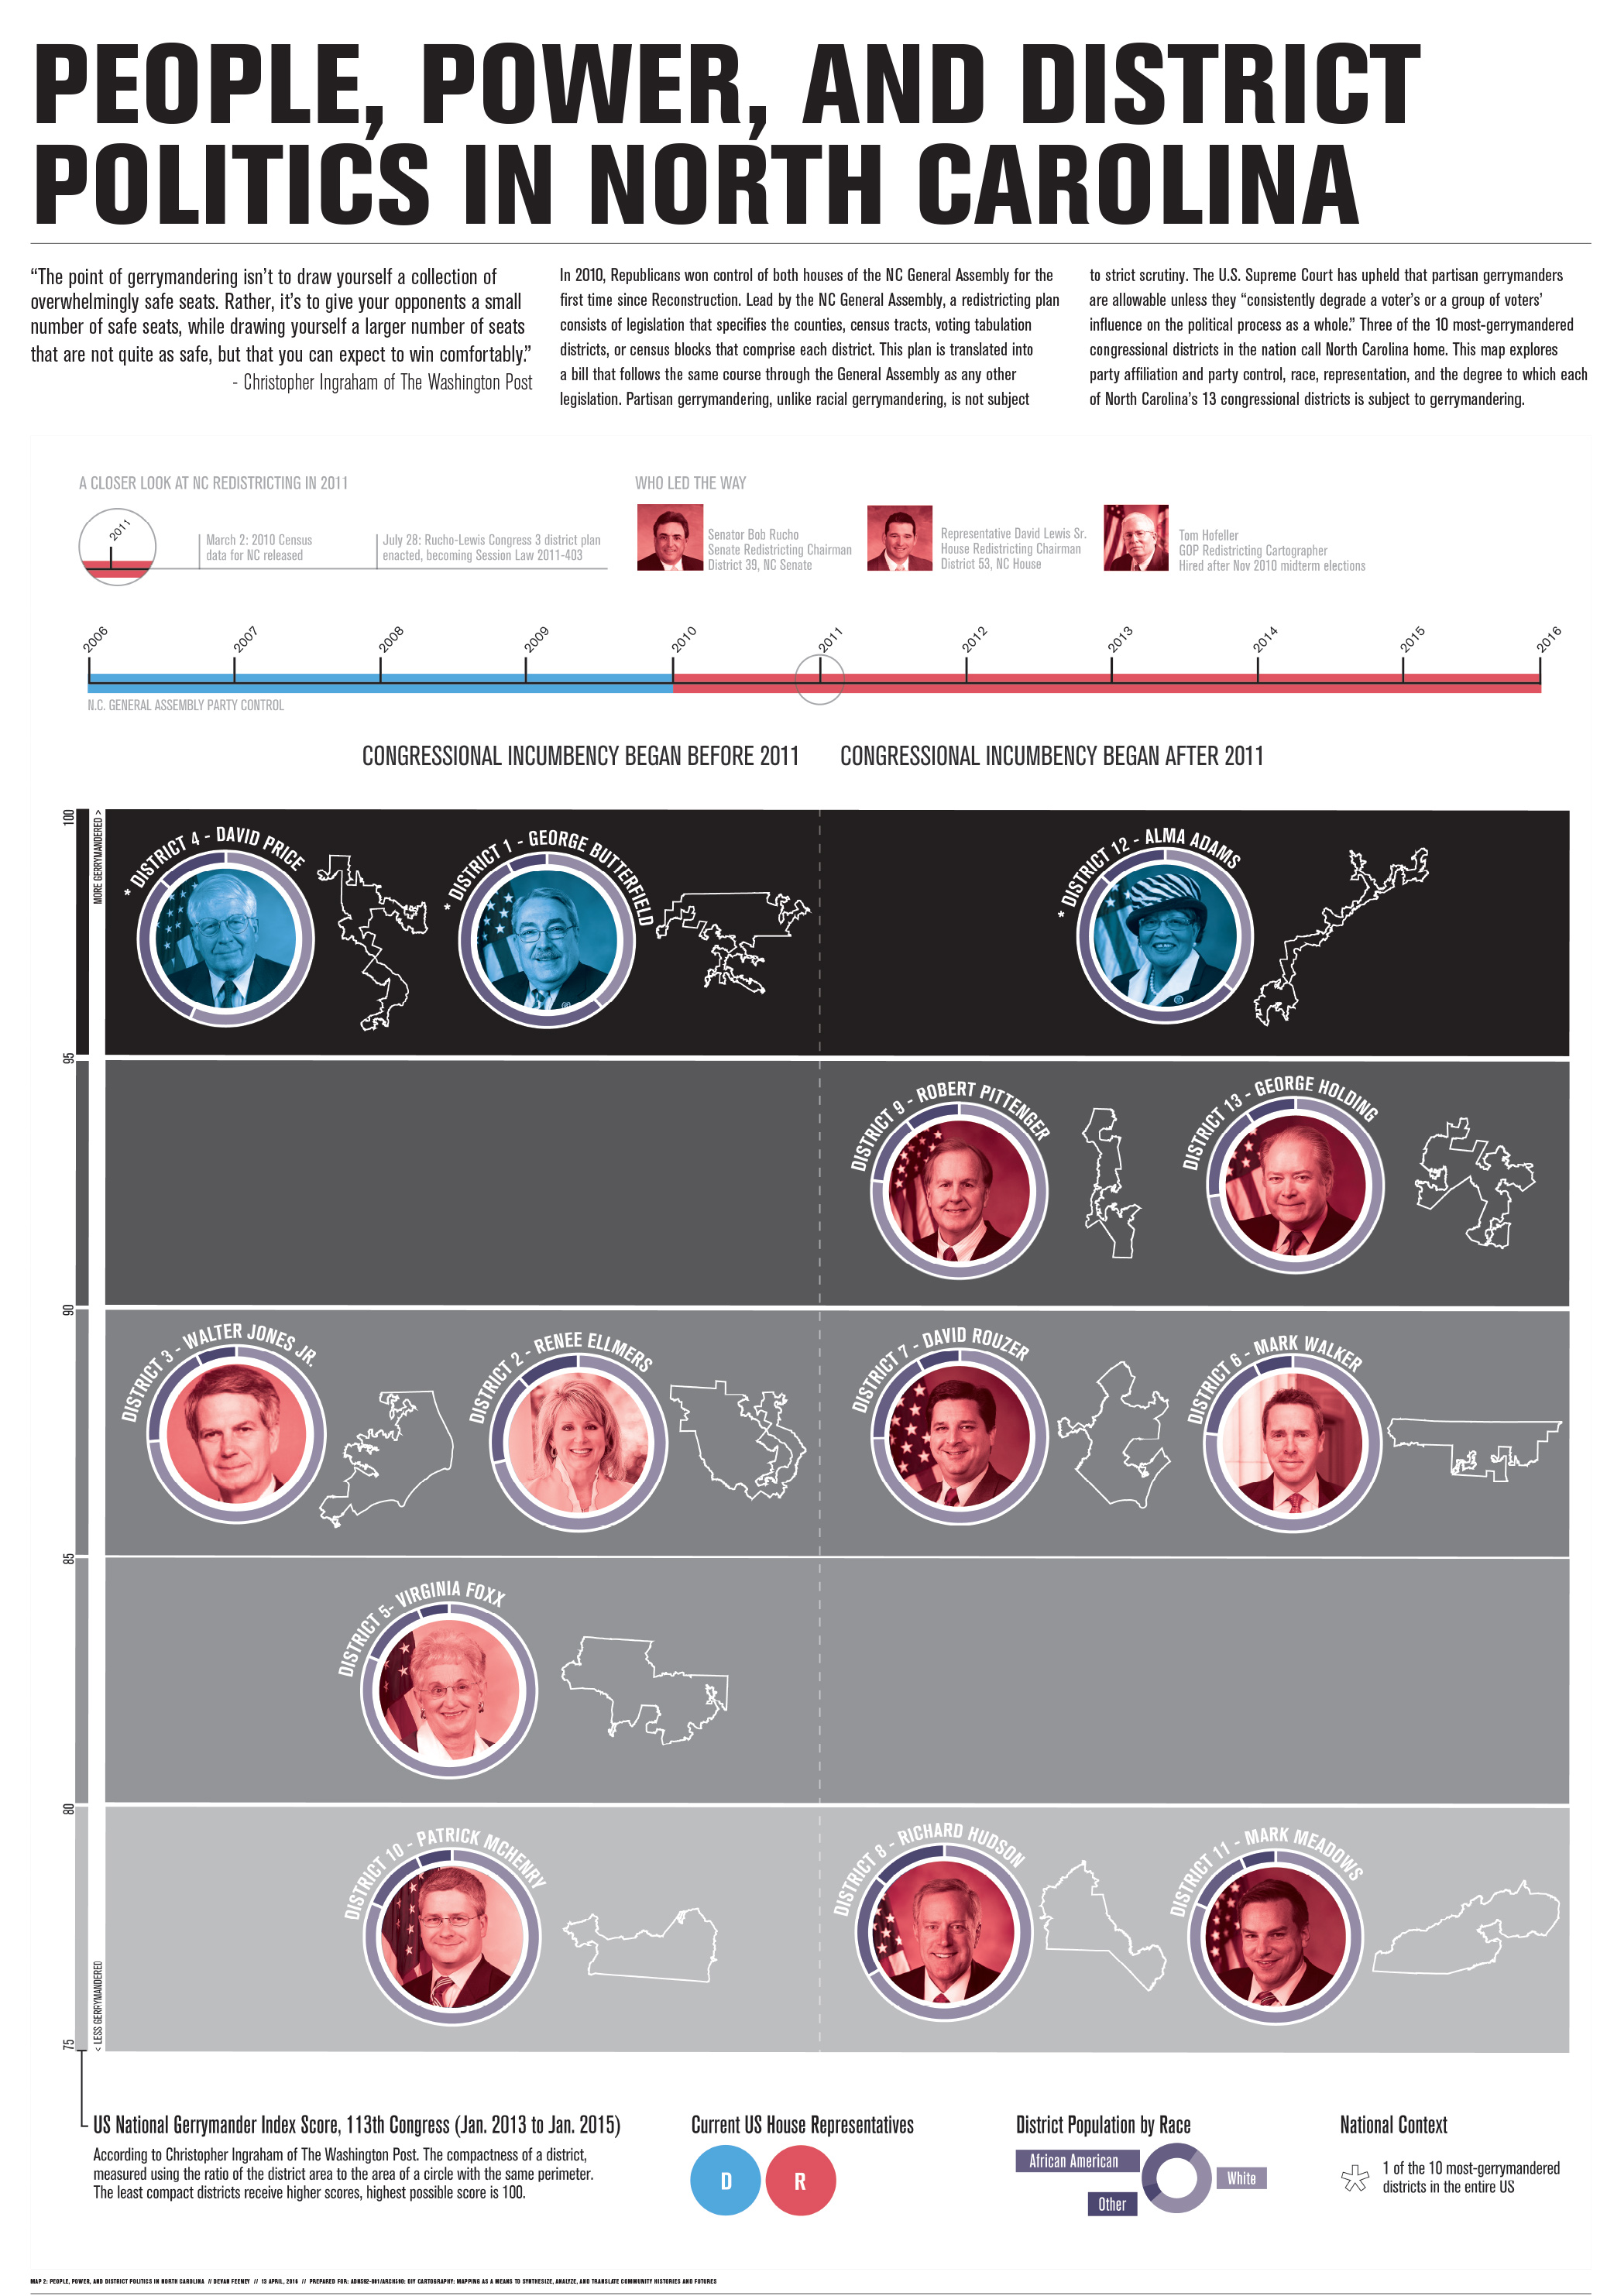
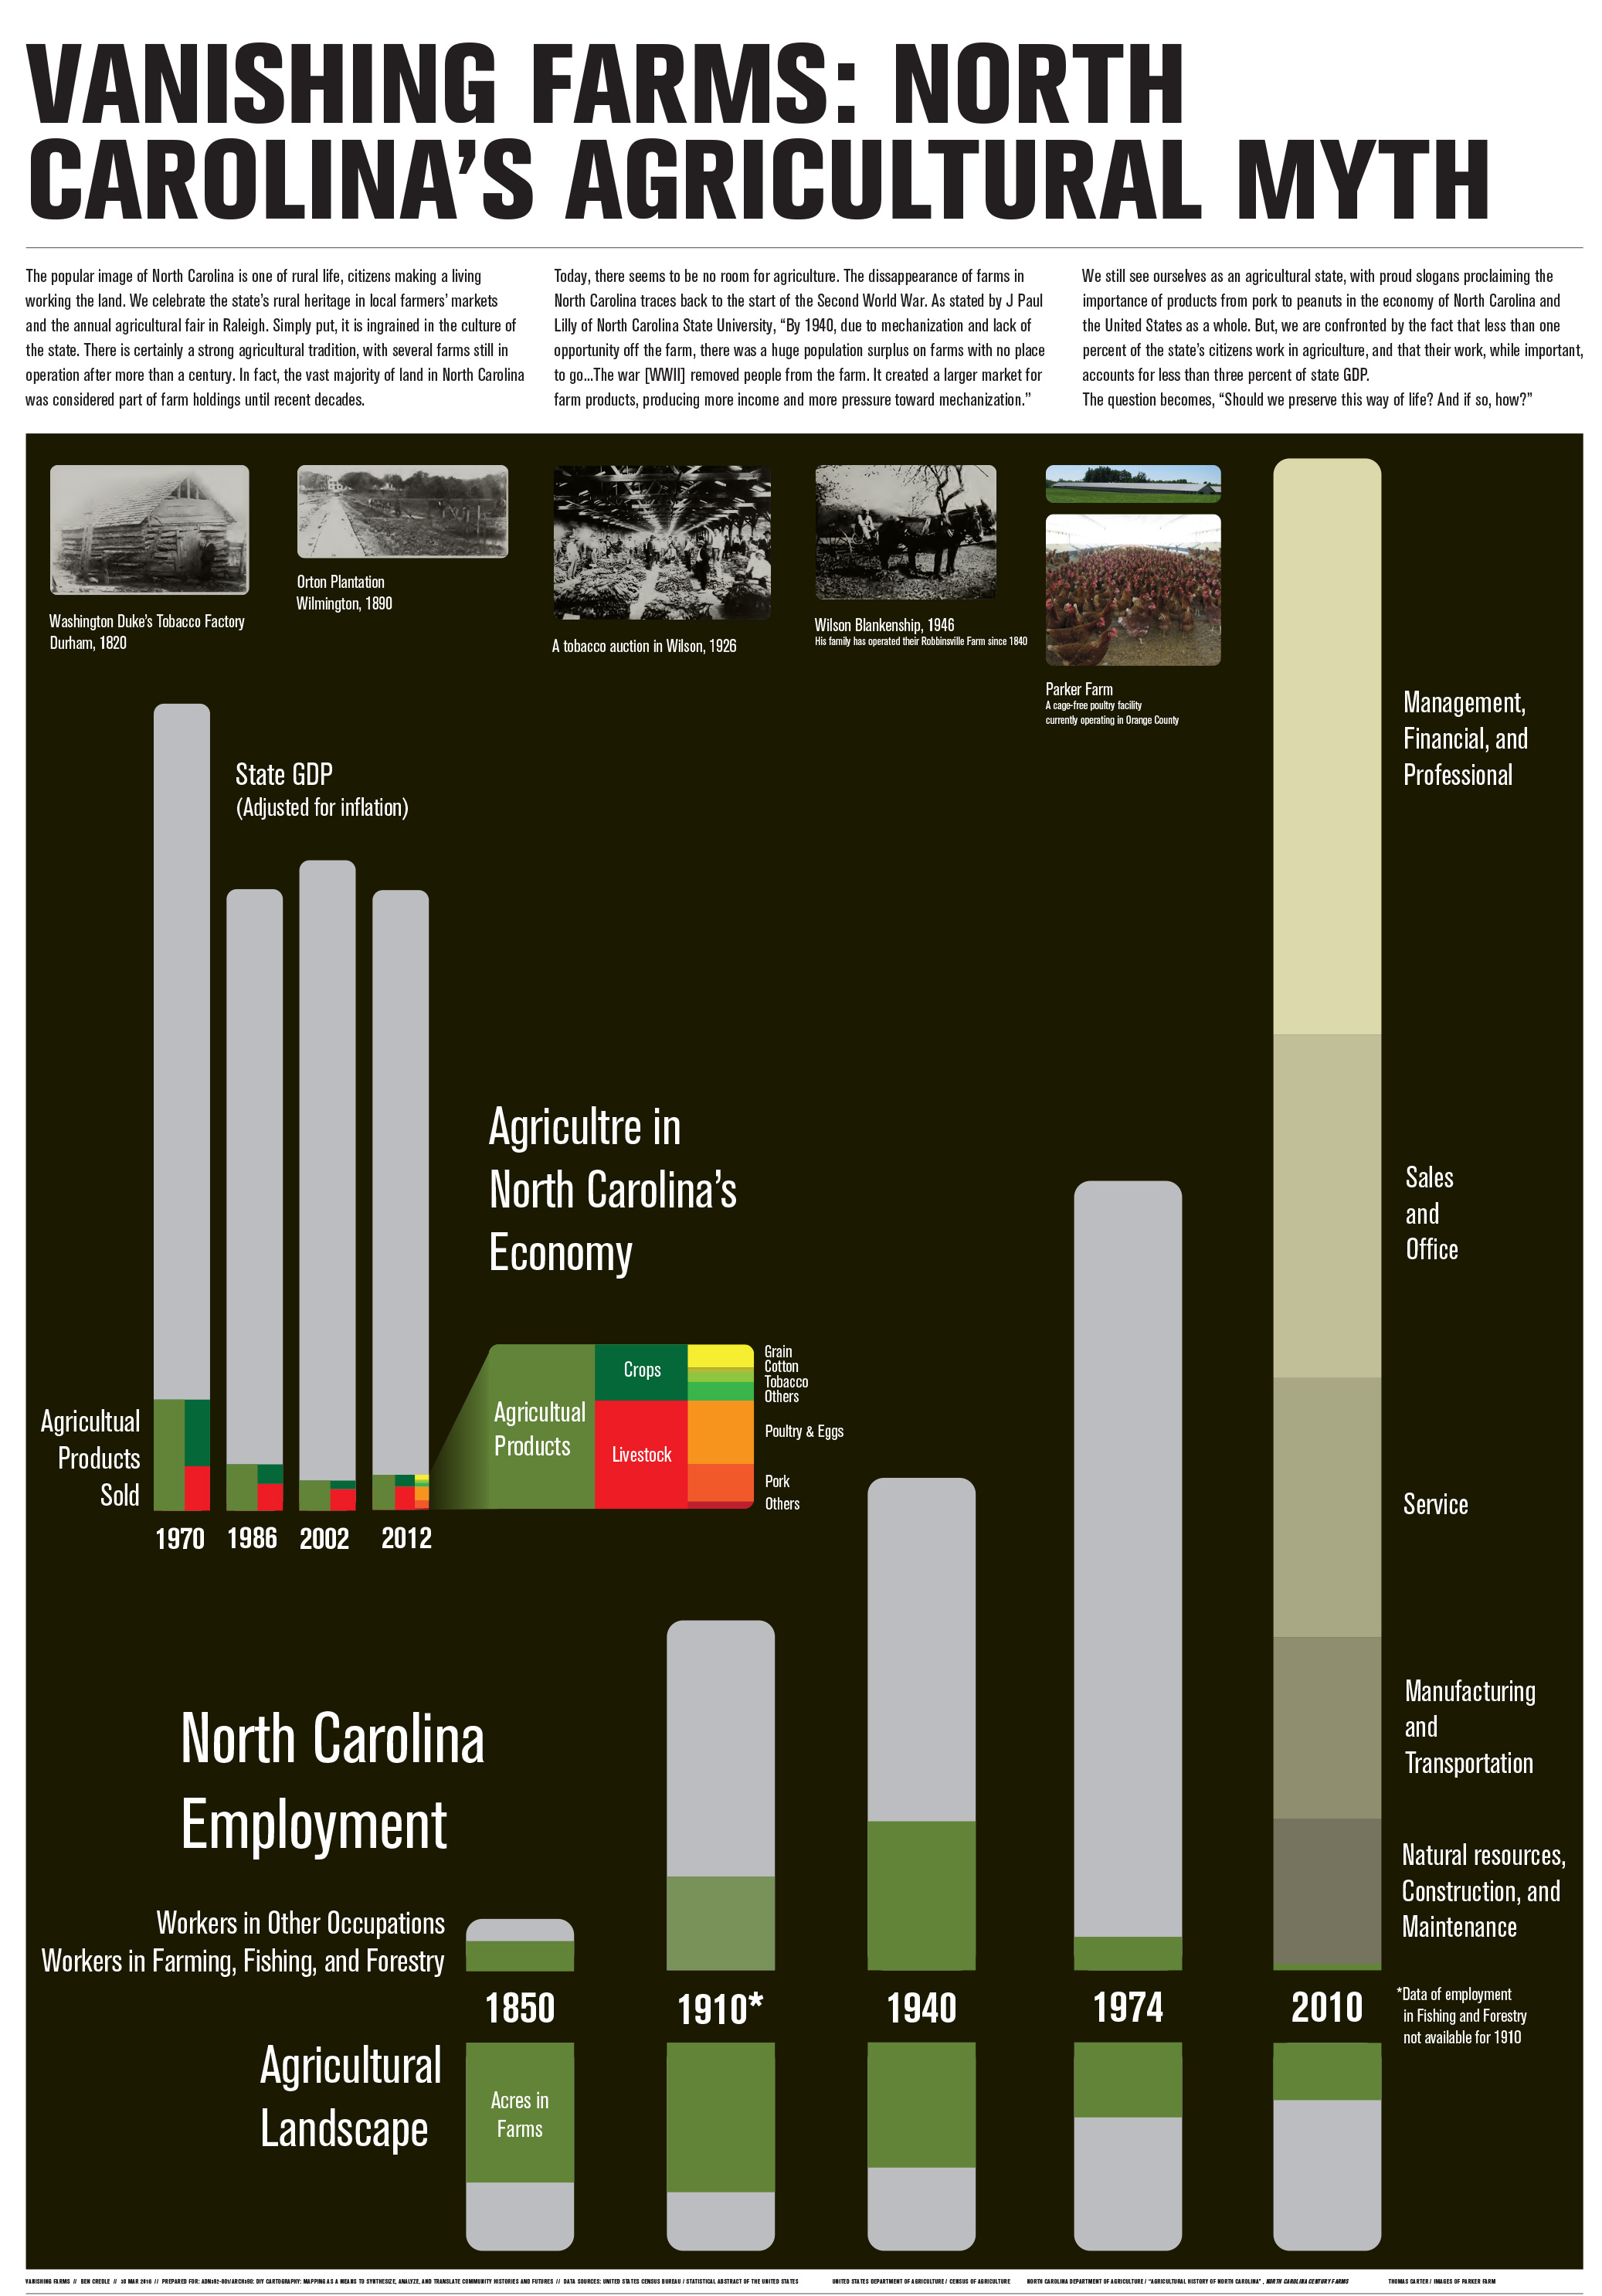
MAP SERIES 02: CONNECTING VISIBLE AND INVISIBLE HISTORIES, EXPOSING MOTIVATIONS
Research Methodology: Correlational
Mapping Methodology: Data / Network Maps
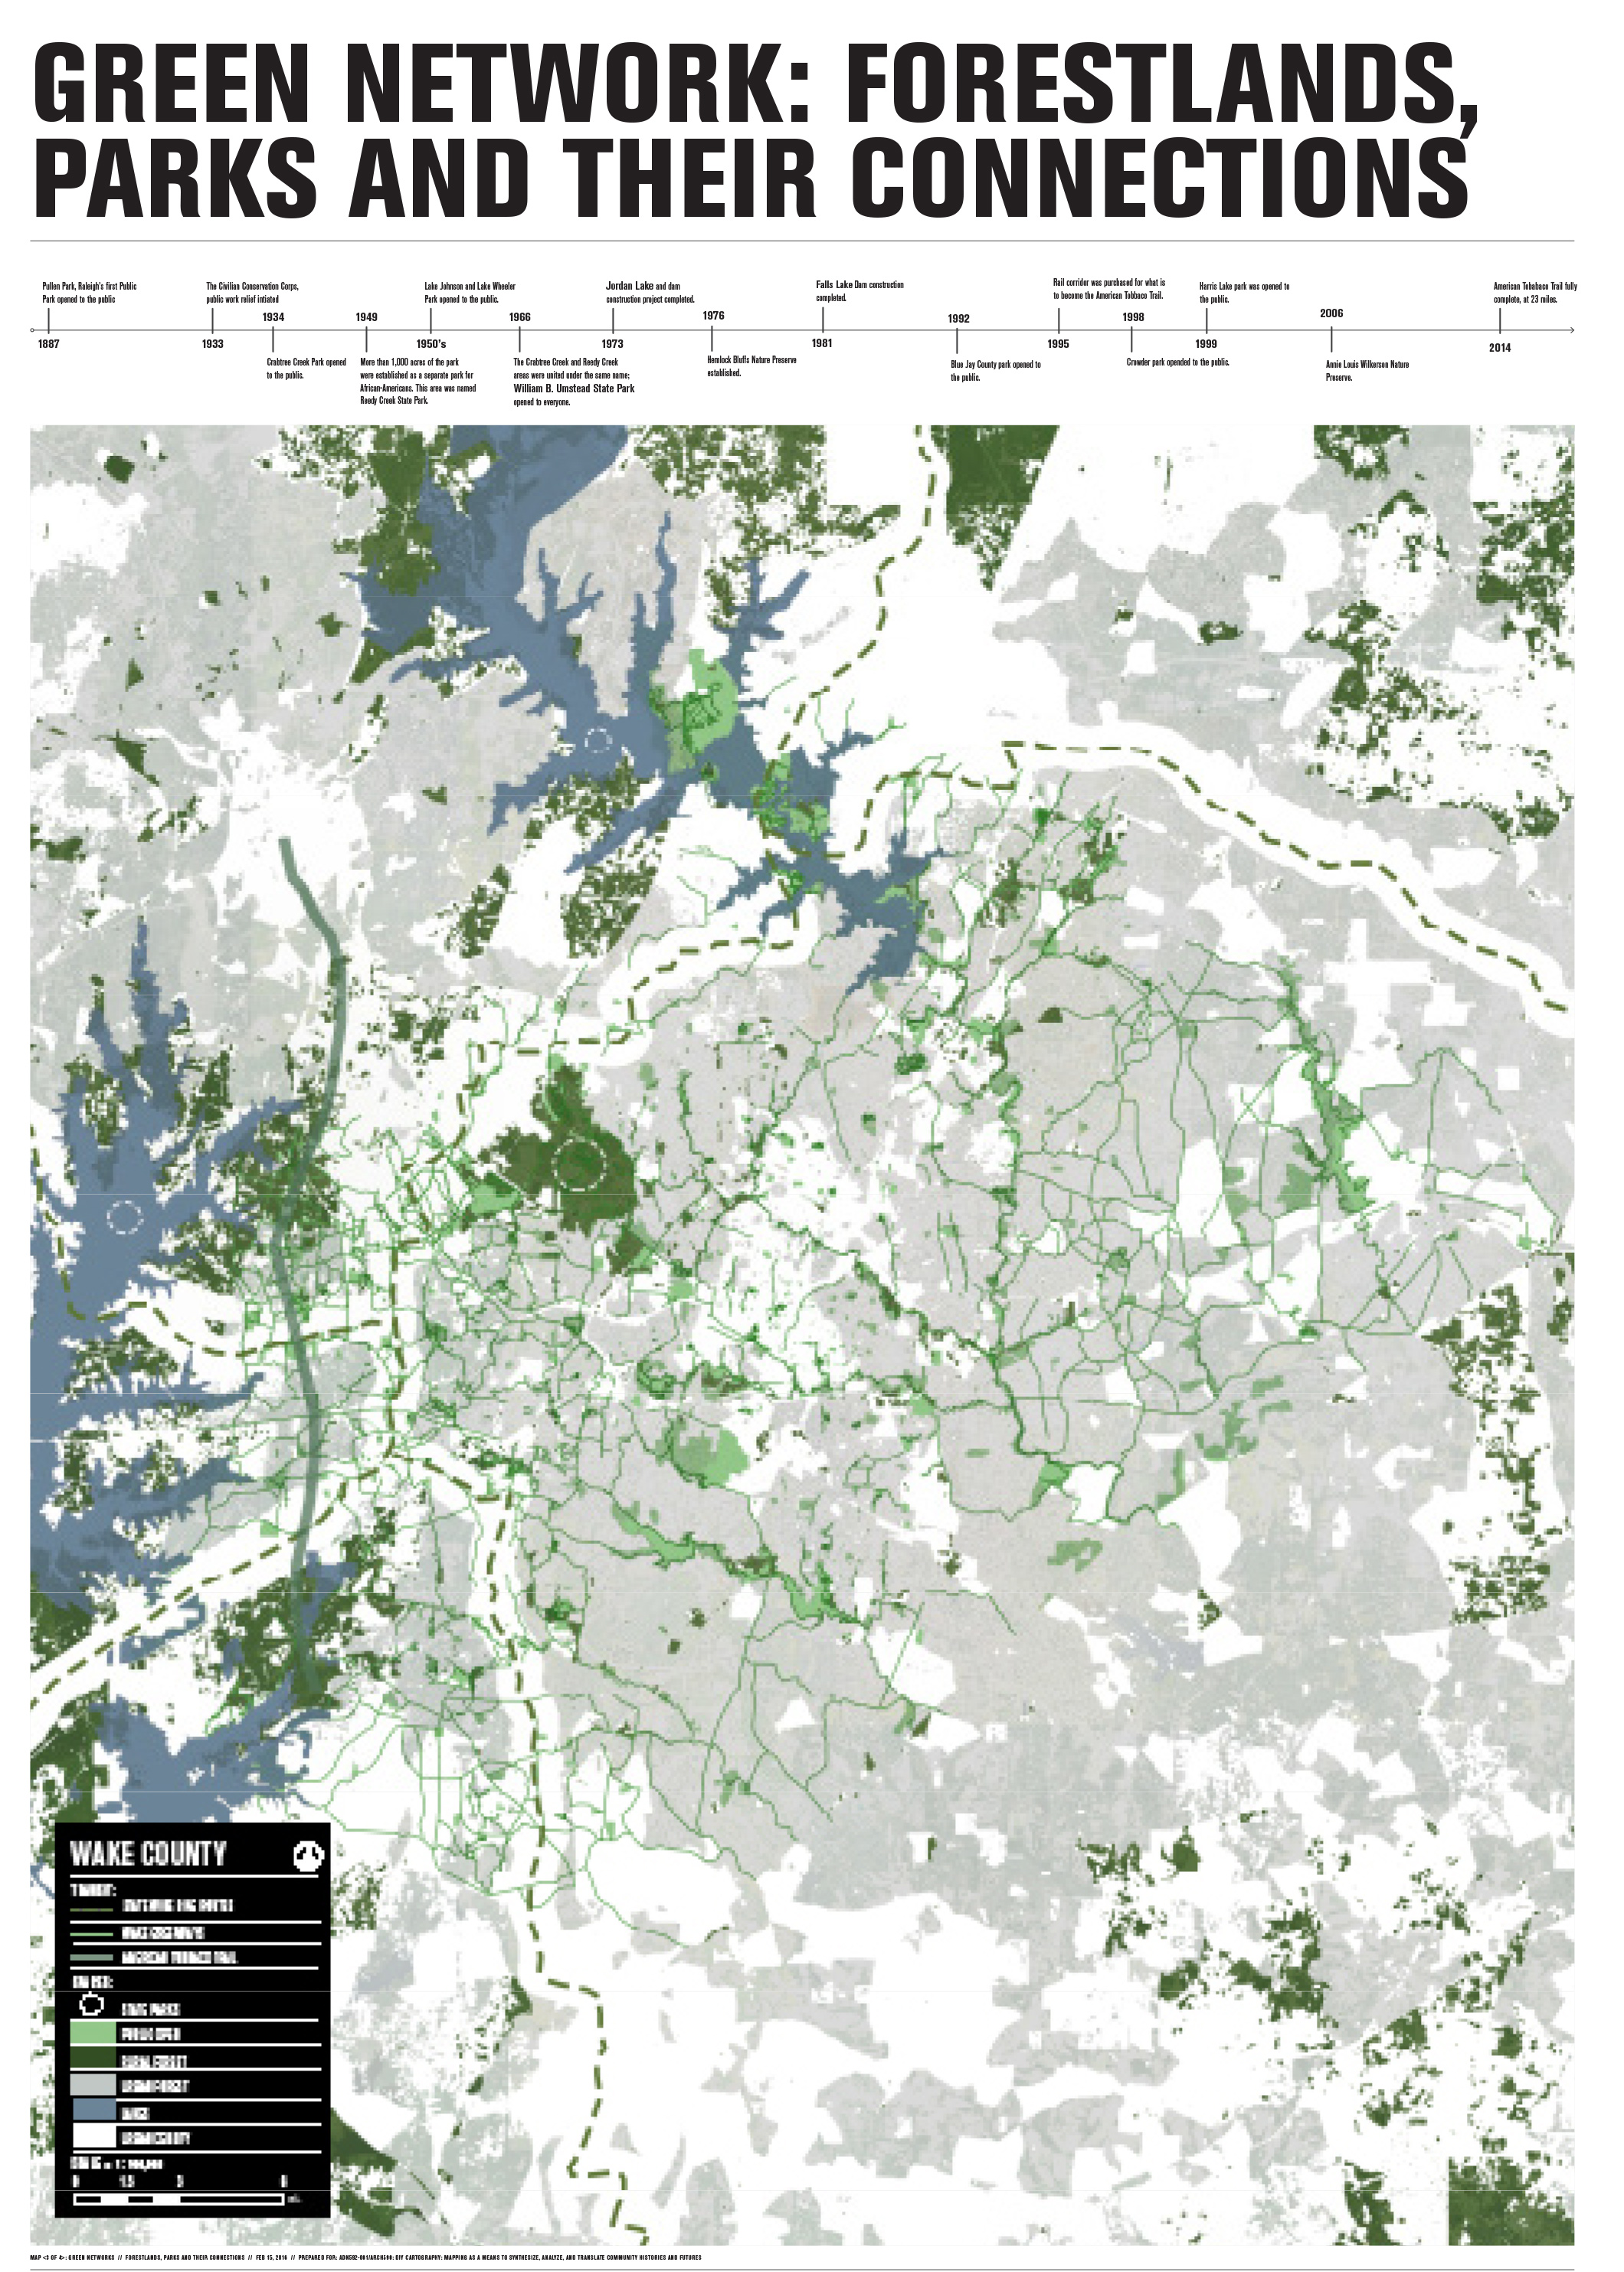
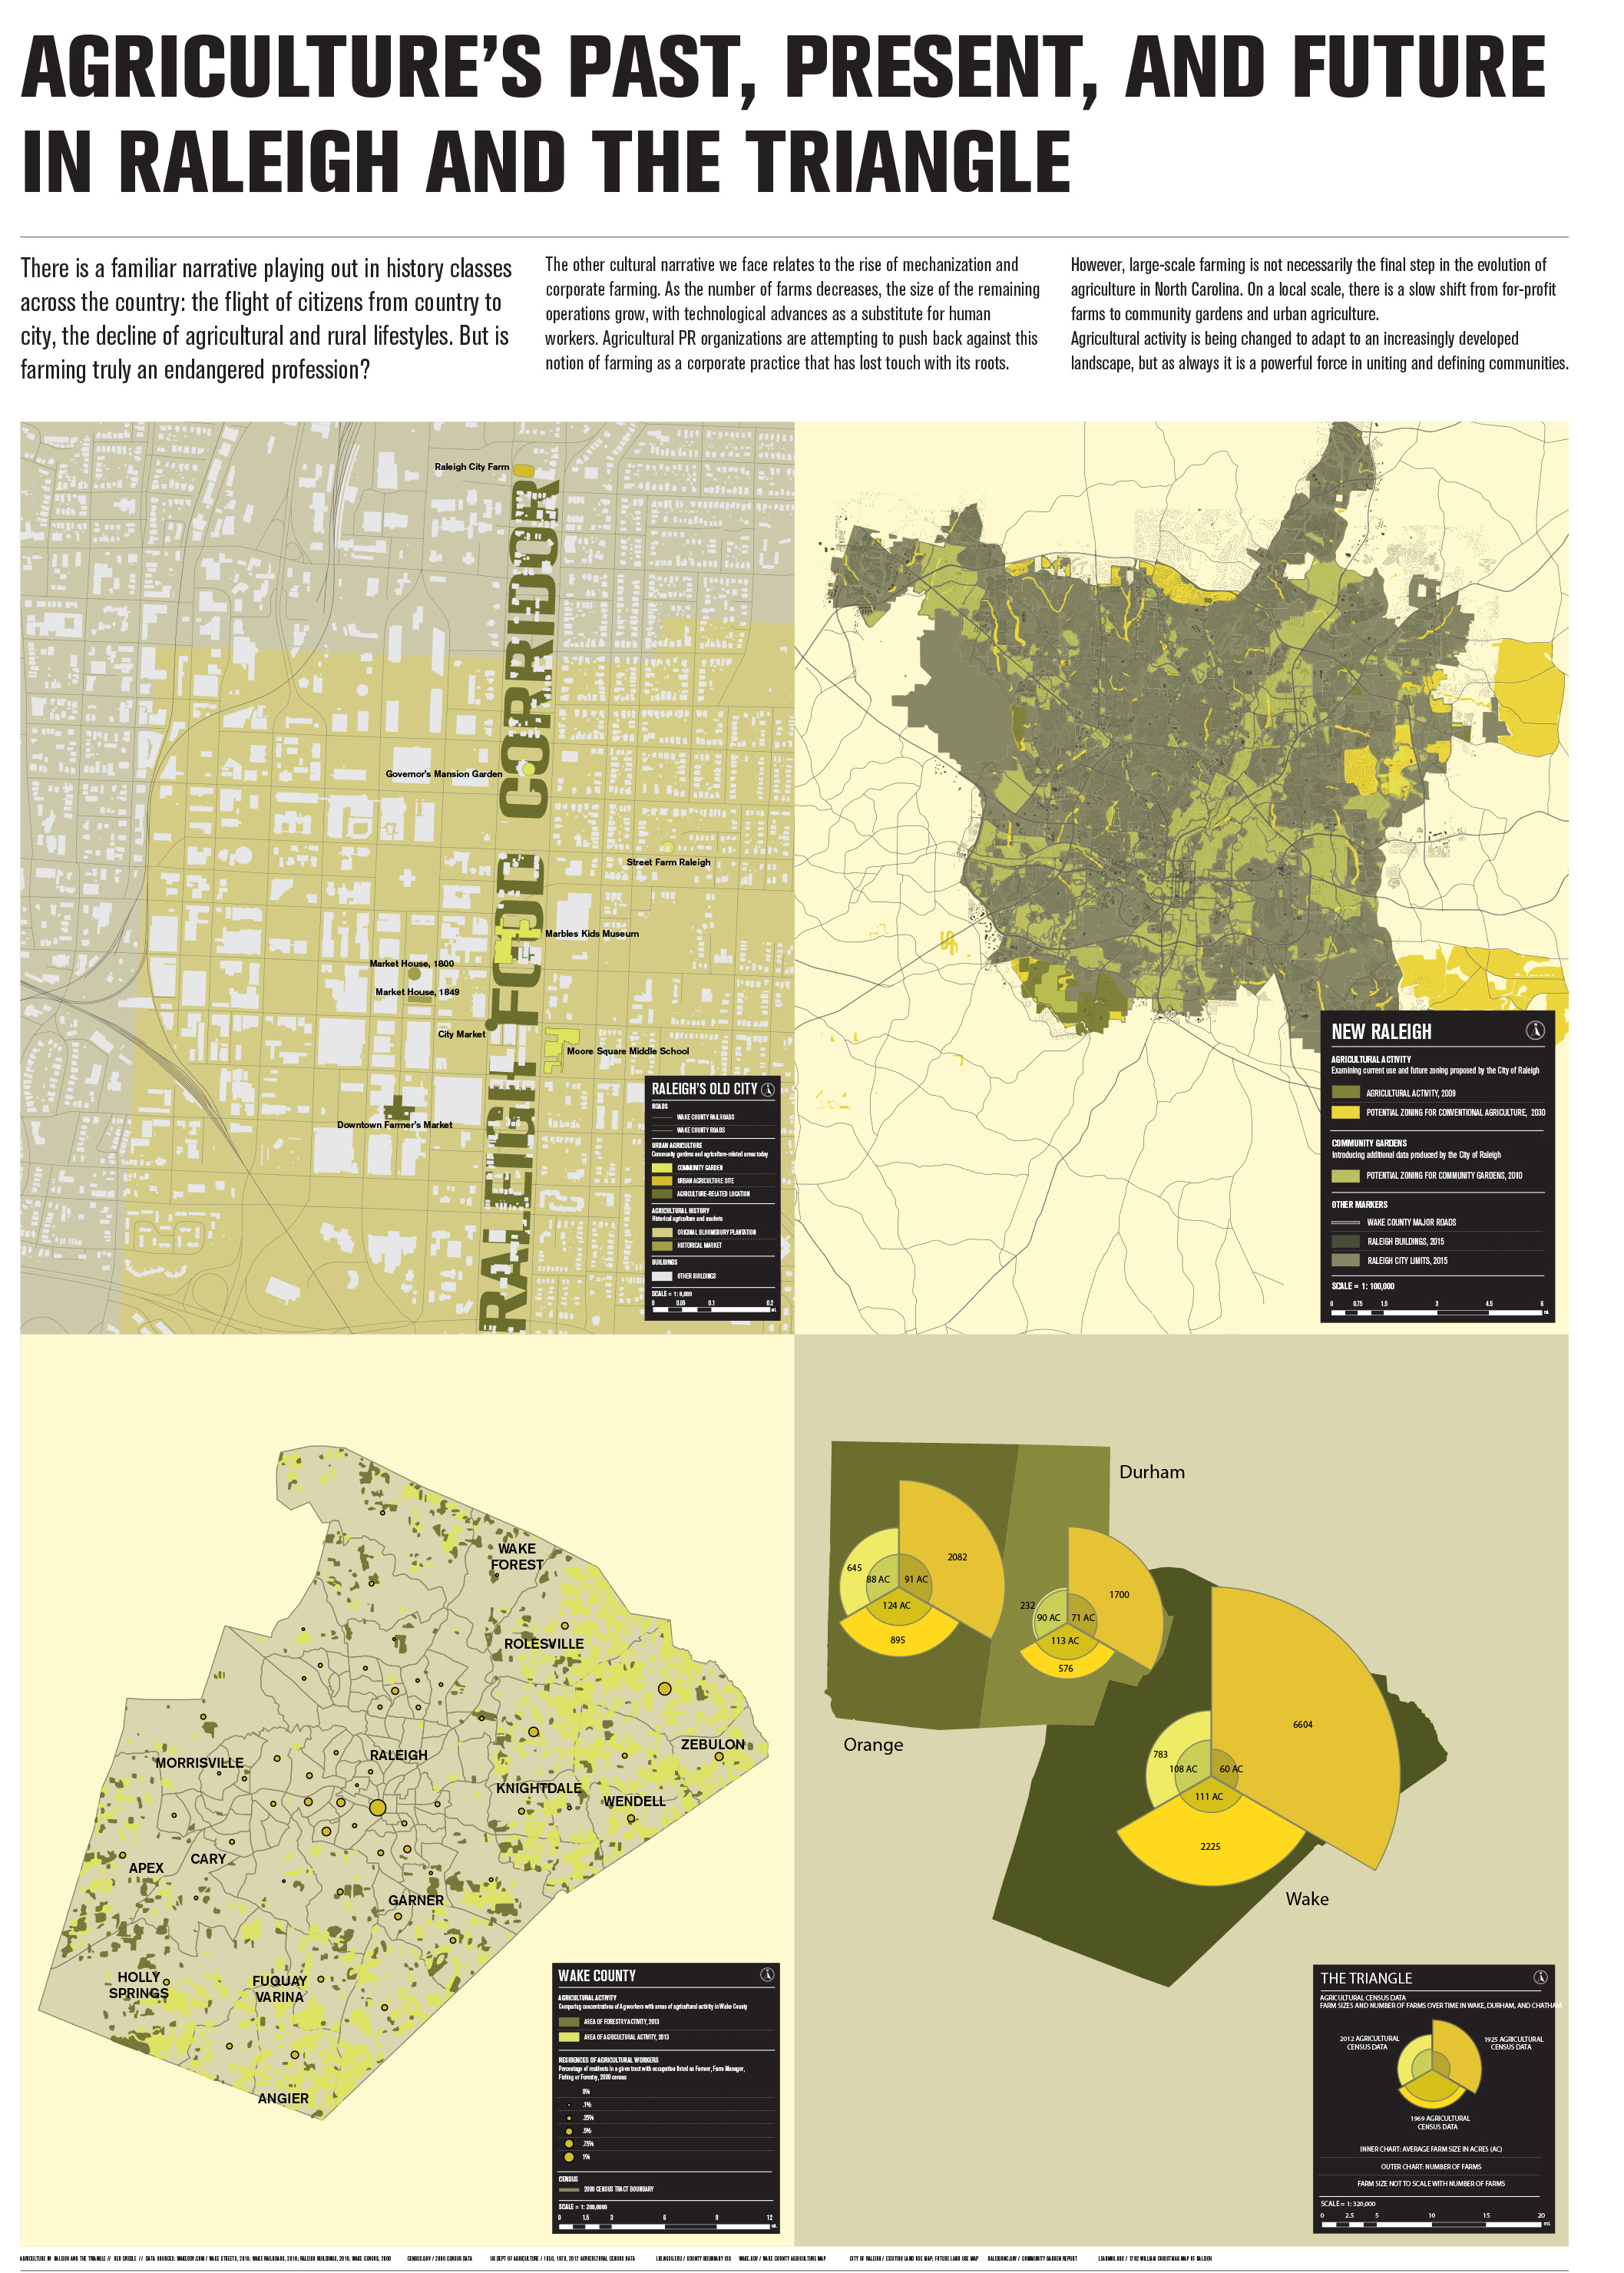
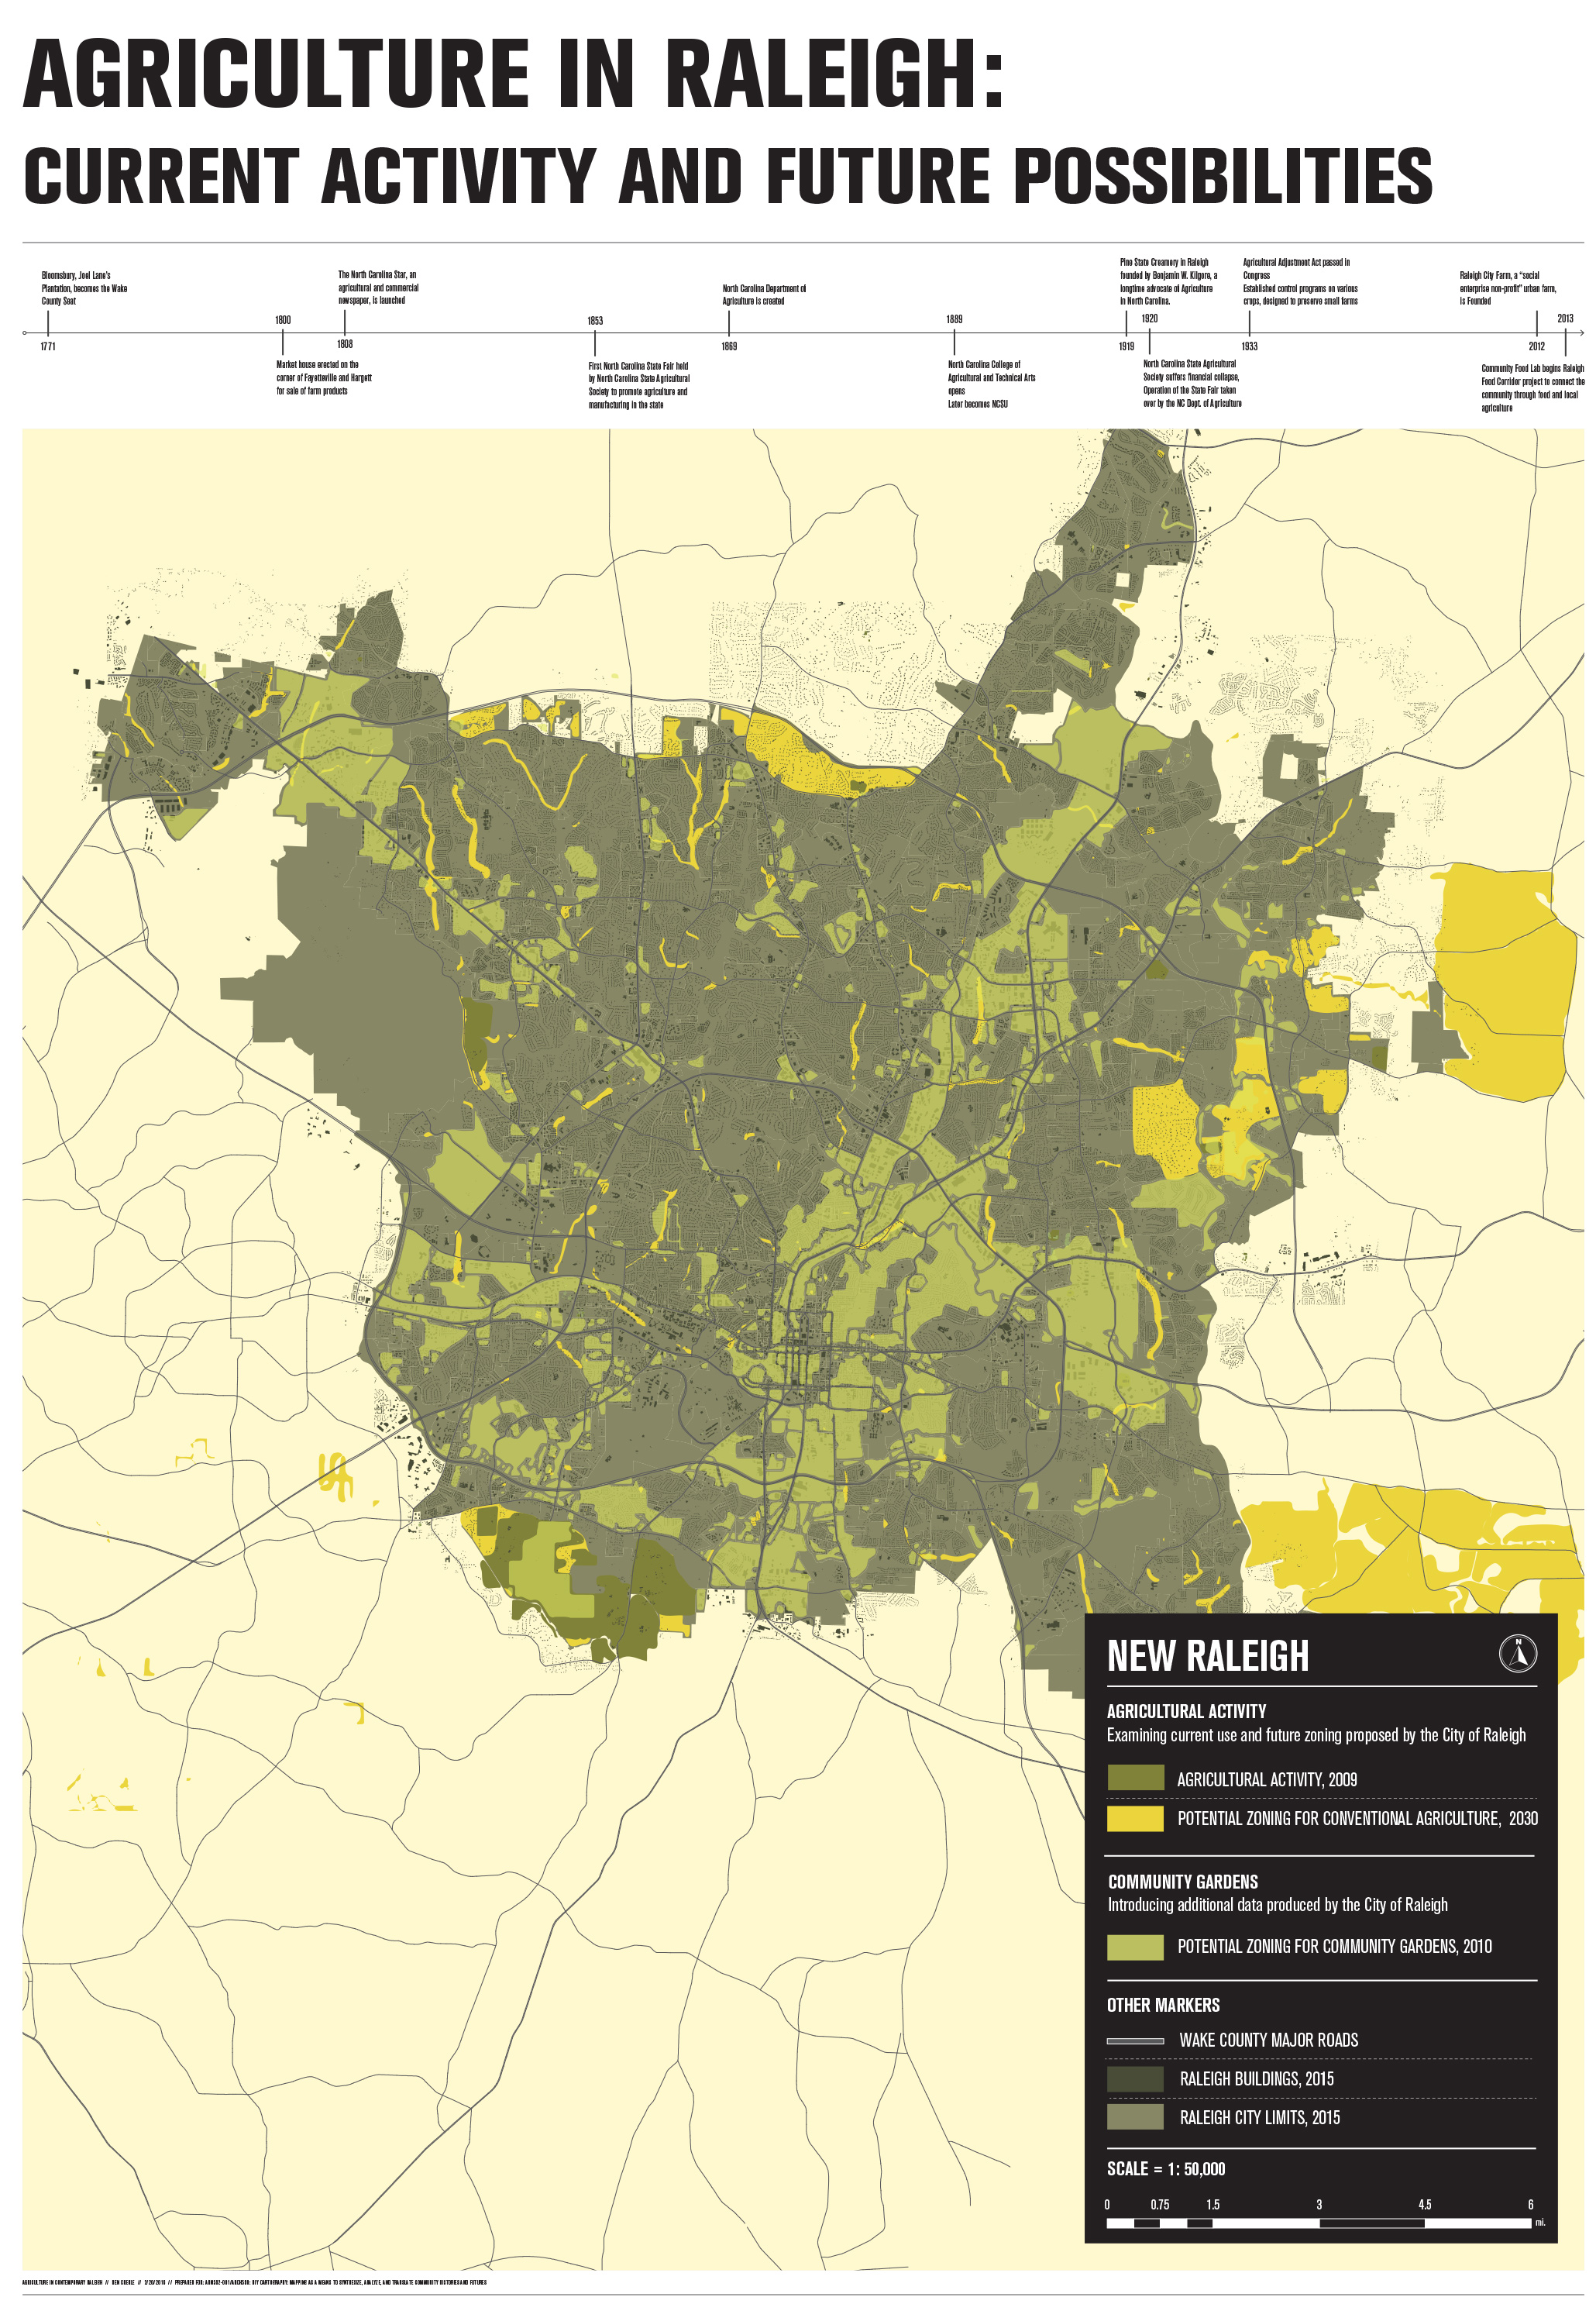
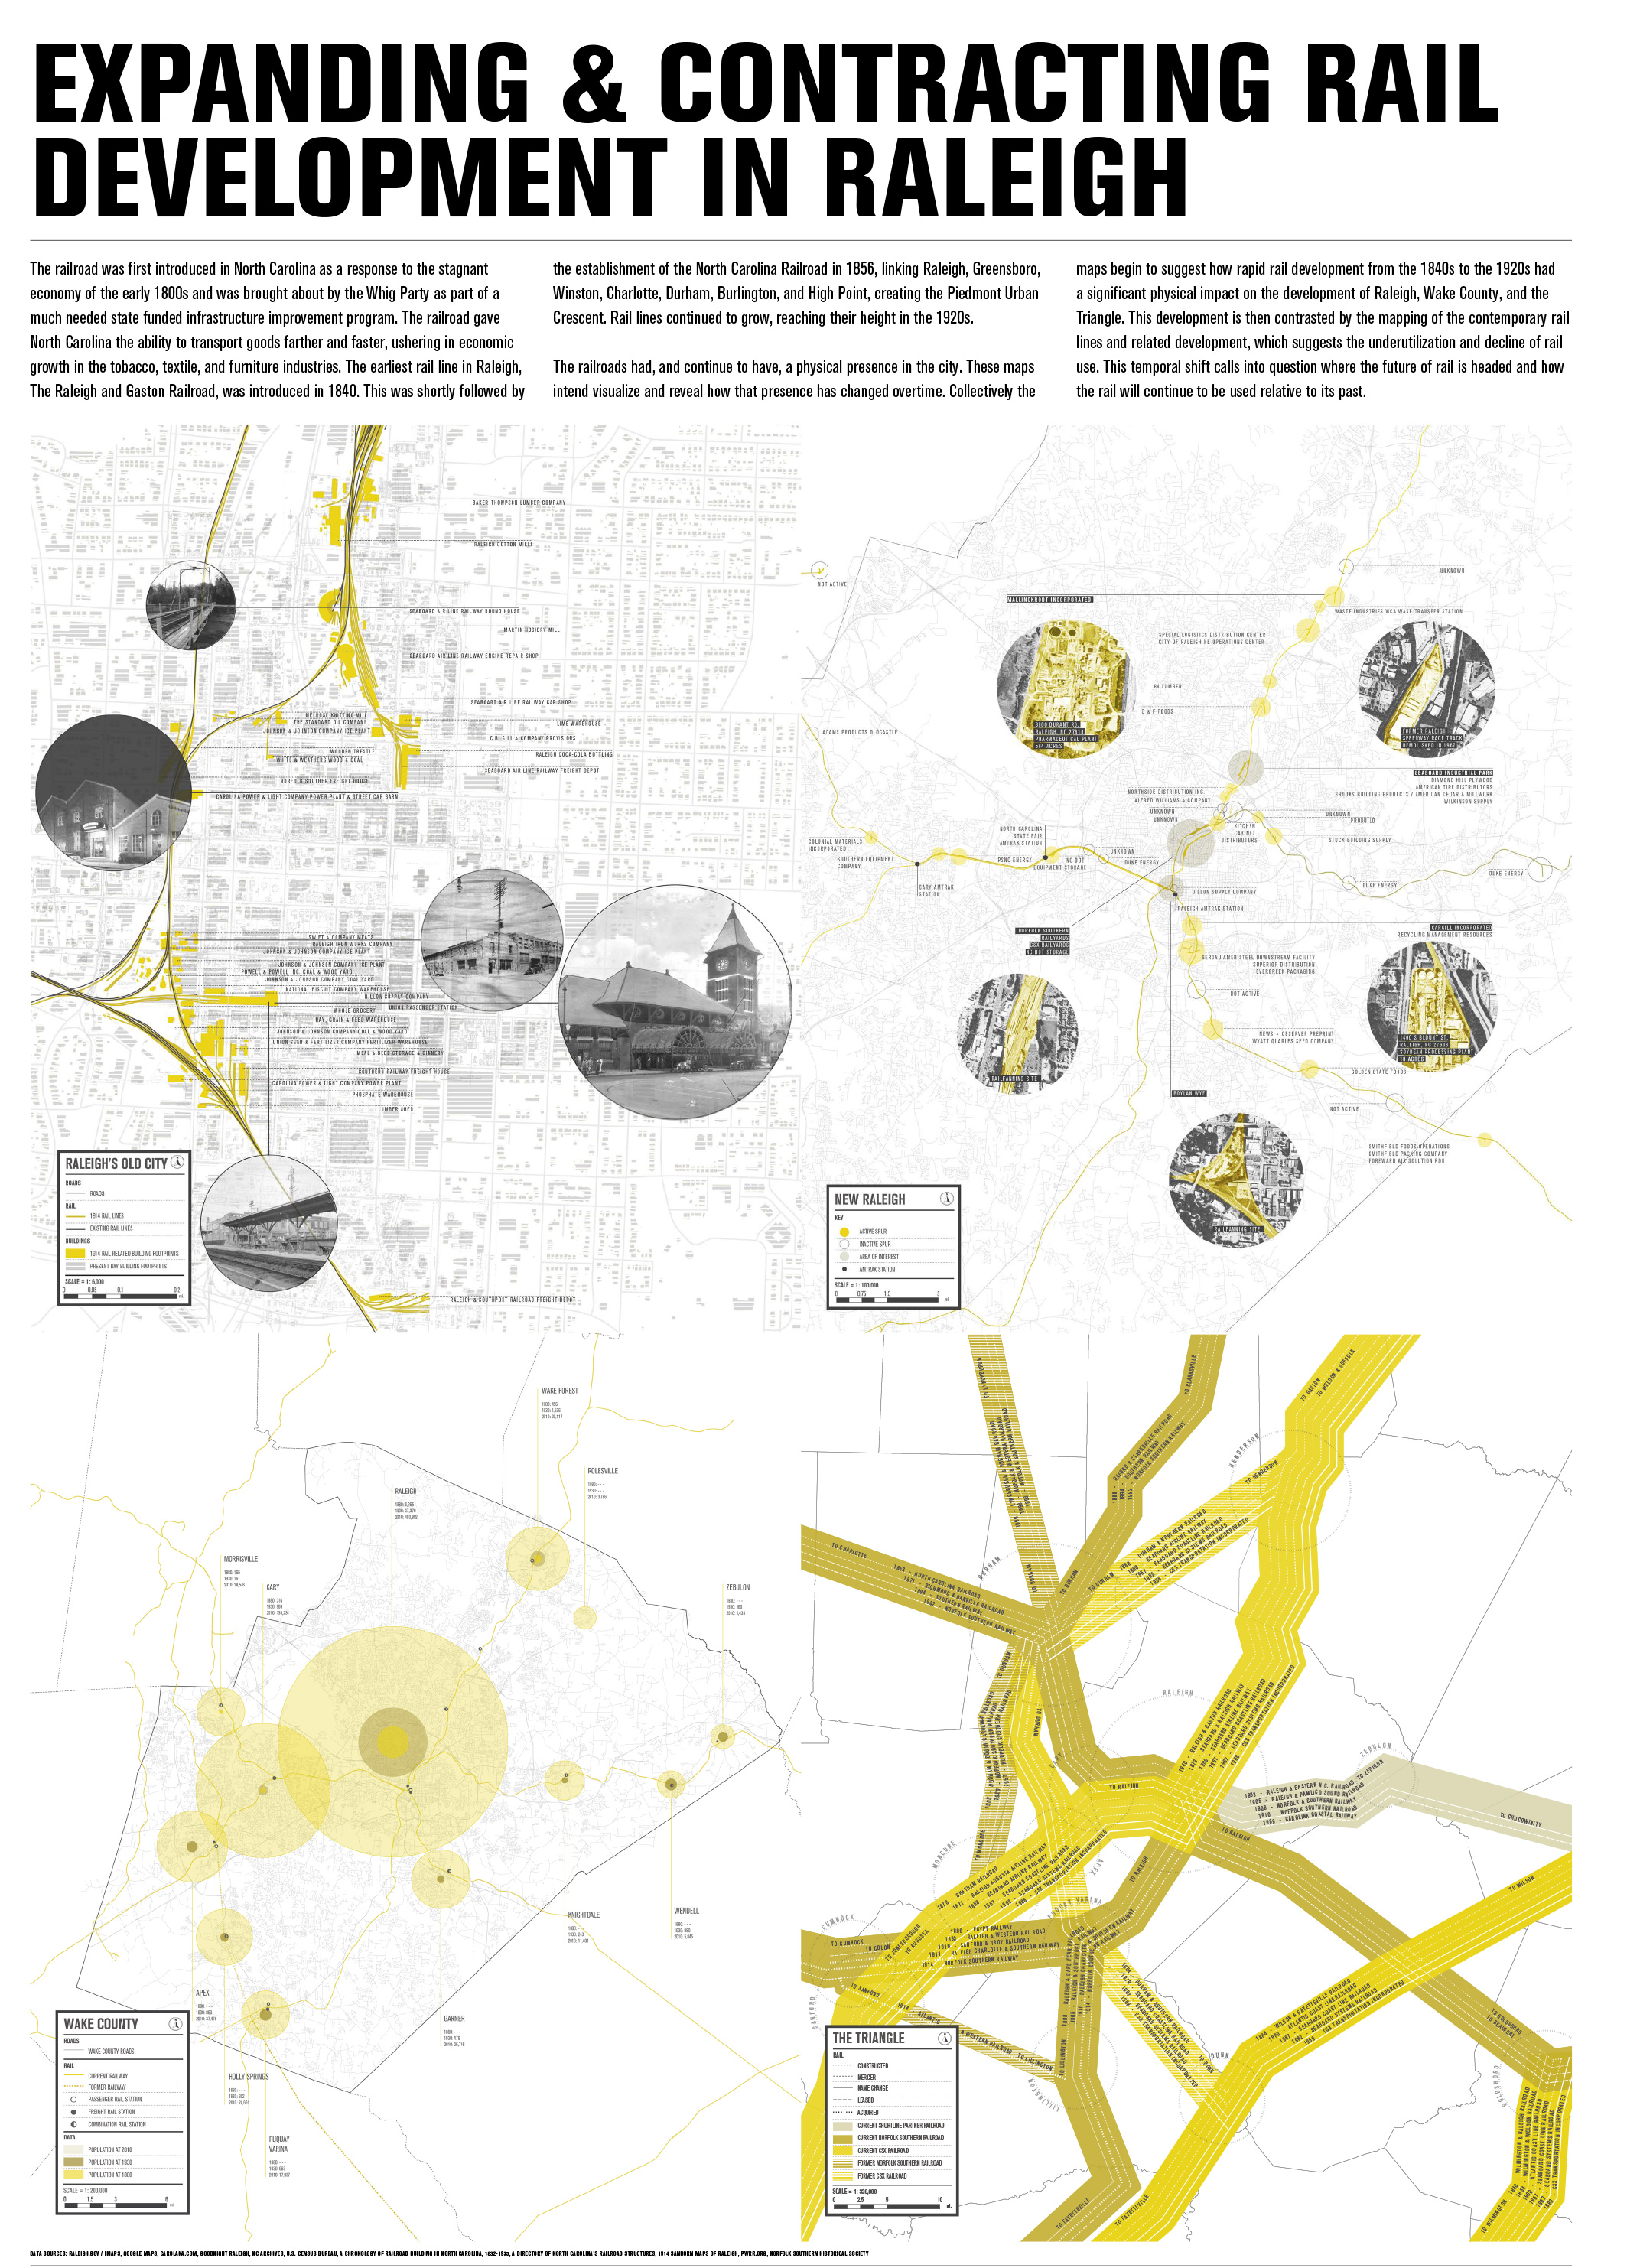
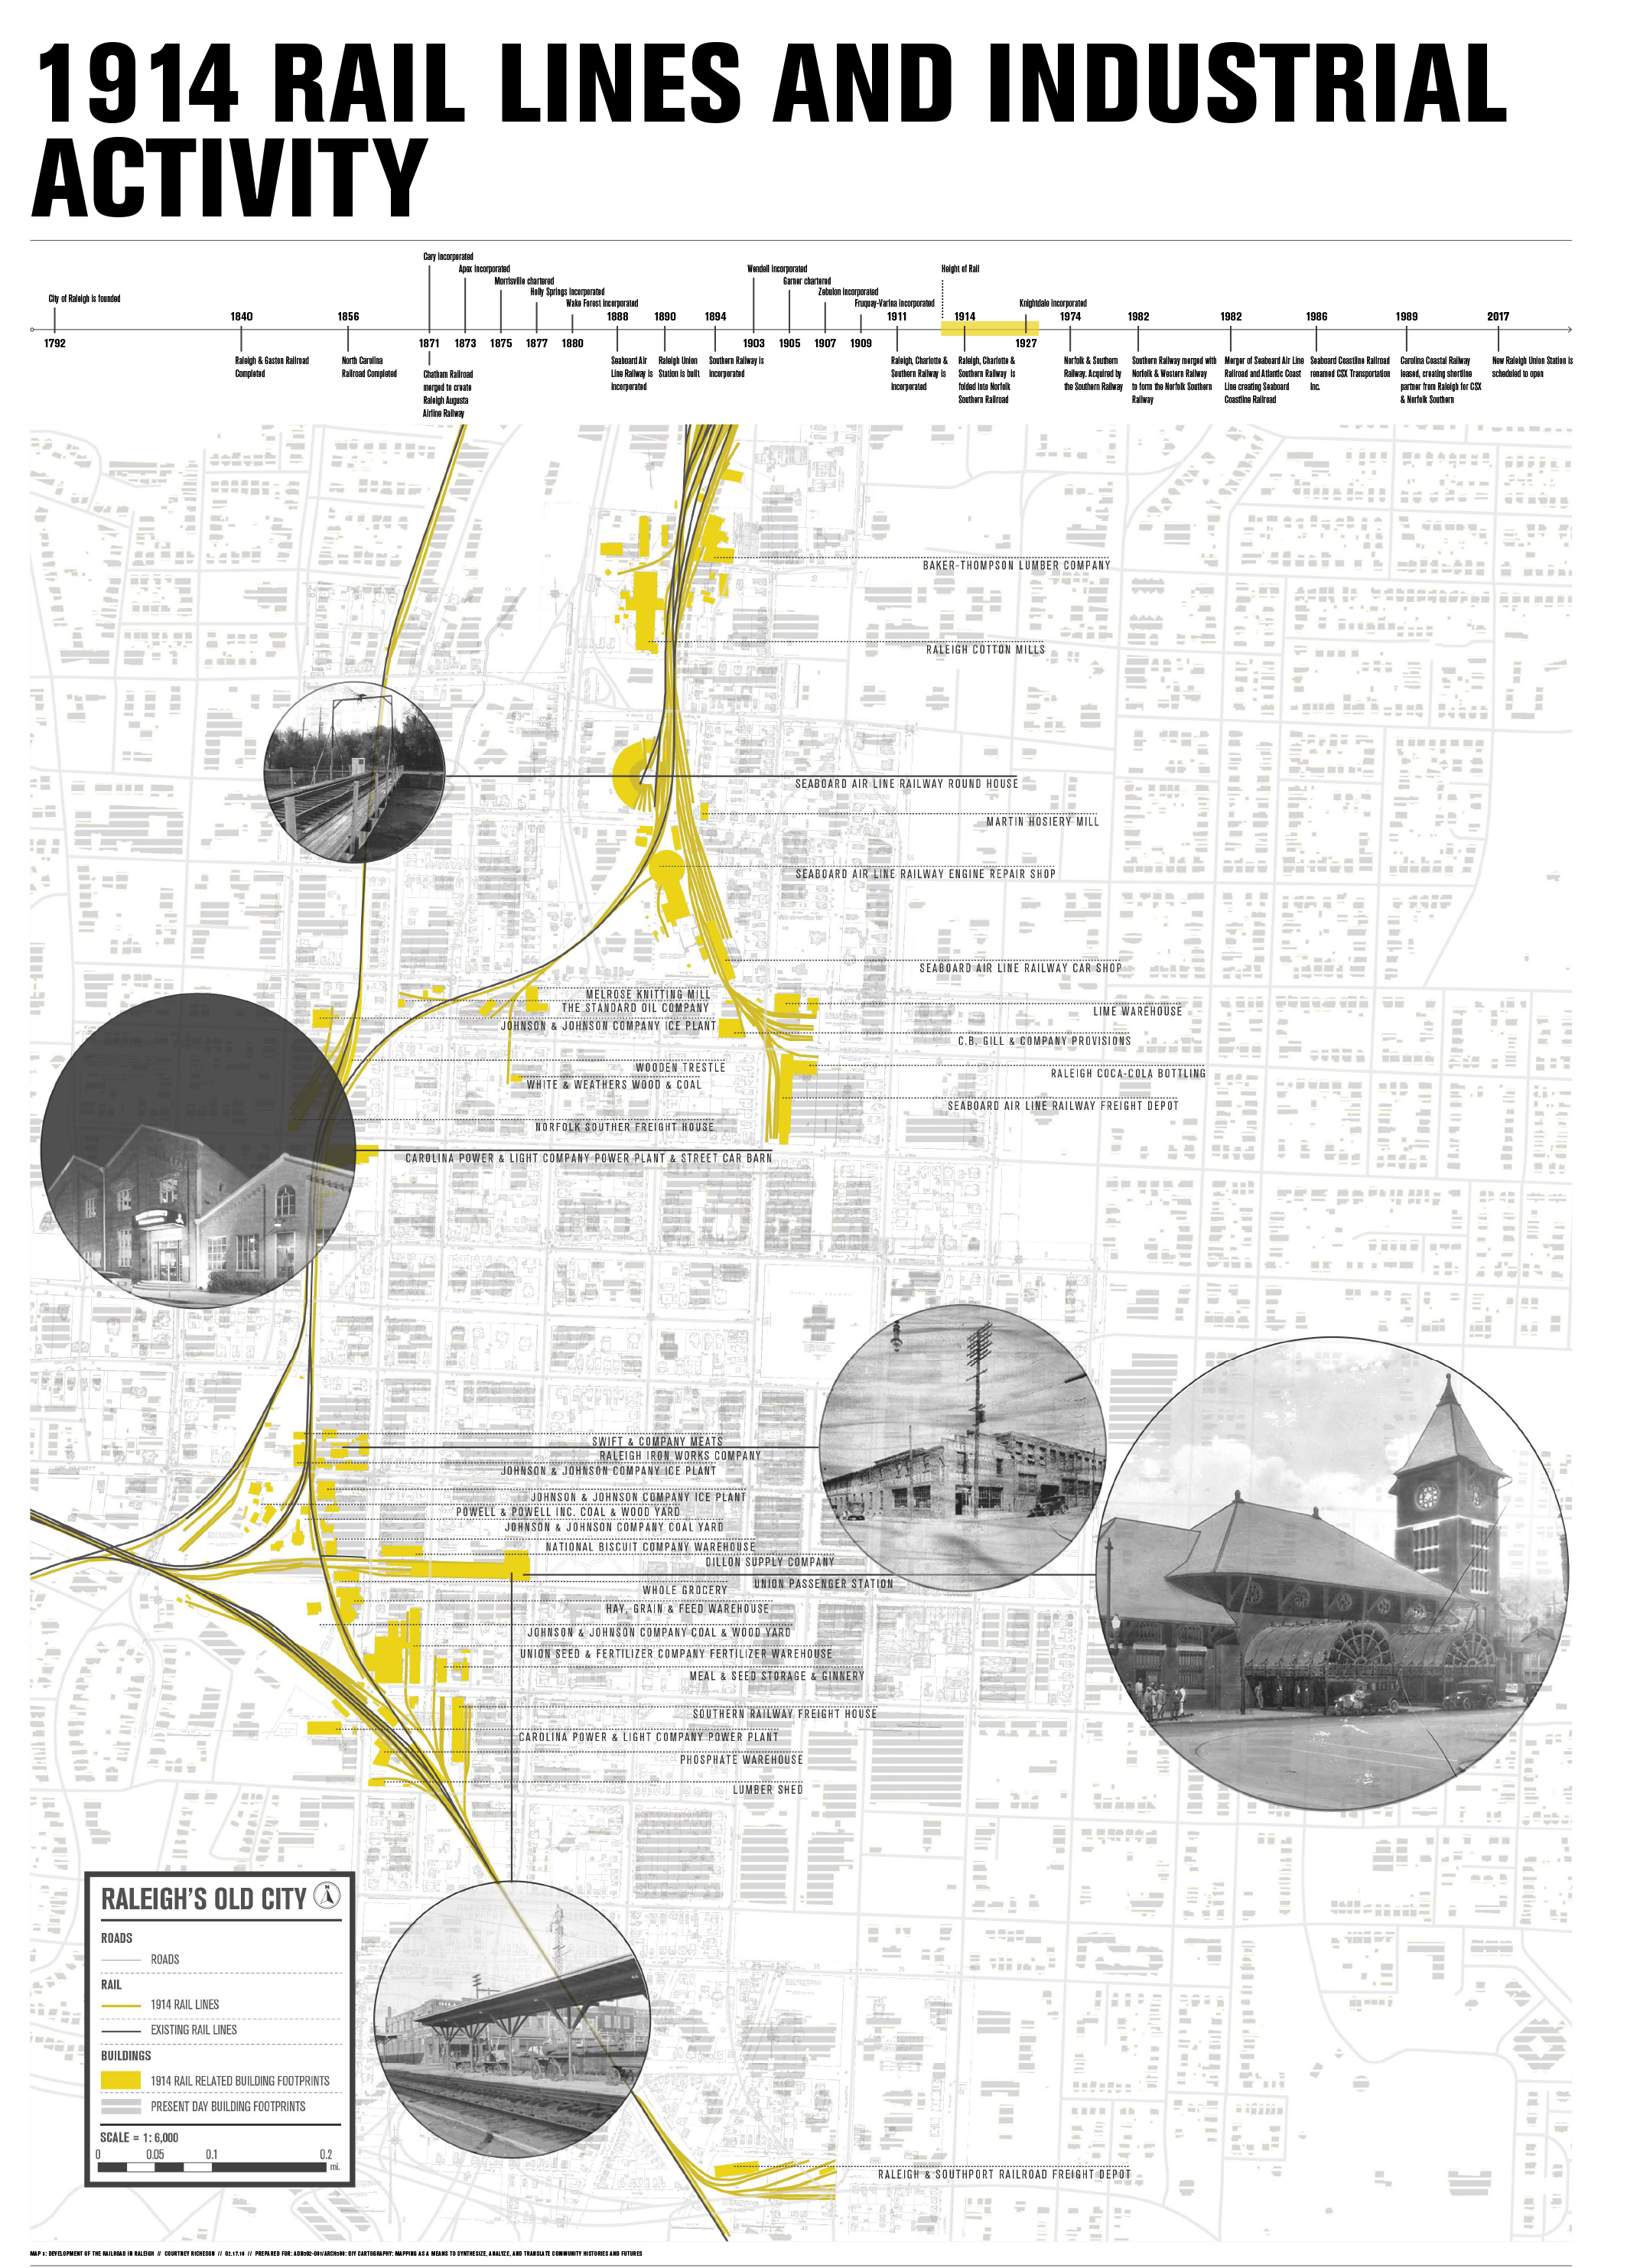
Based on findings from the first map, students identified a larger narrative they were interested in studying. Each student was assigned a set of marked and unmarked histories to incorporate into their narrative, and was expected to include additional narratives that resulted from independent research . They also looked at how the systems inherent in the event/person/place affected the infrastructural development of the city.

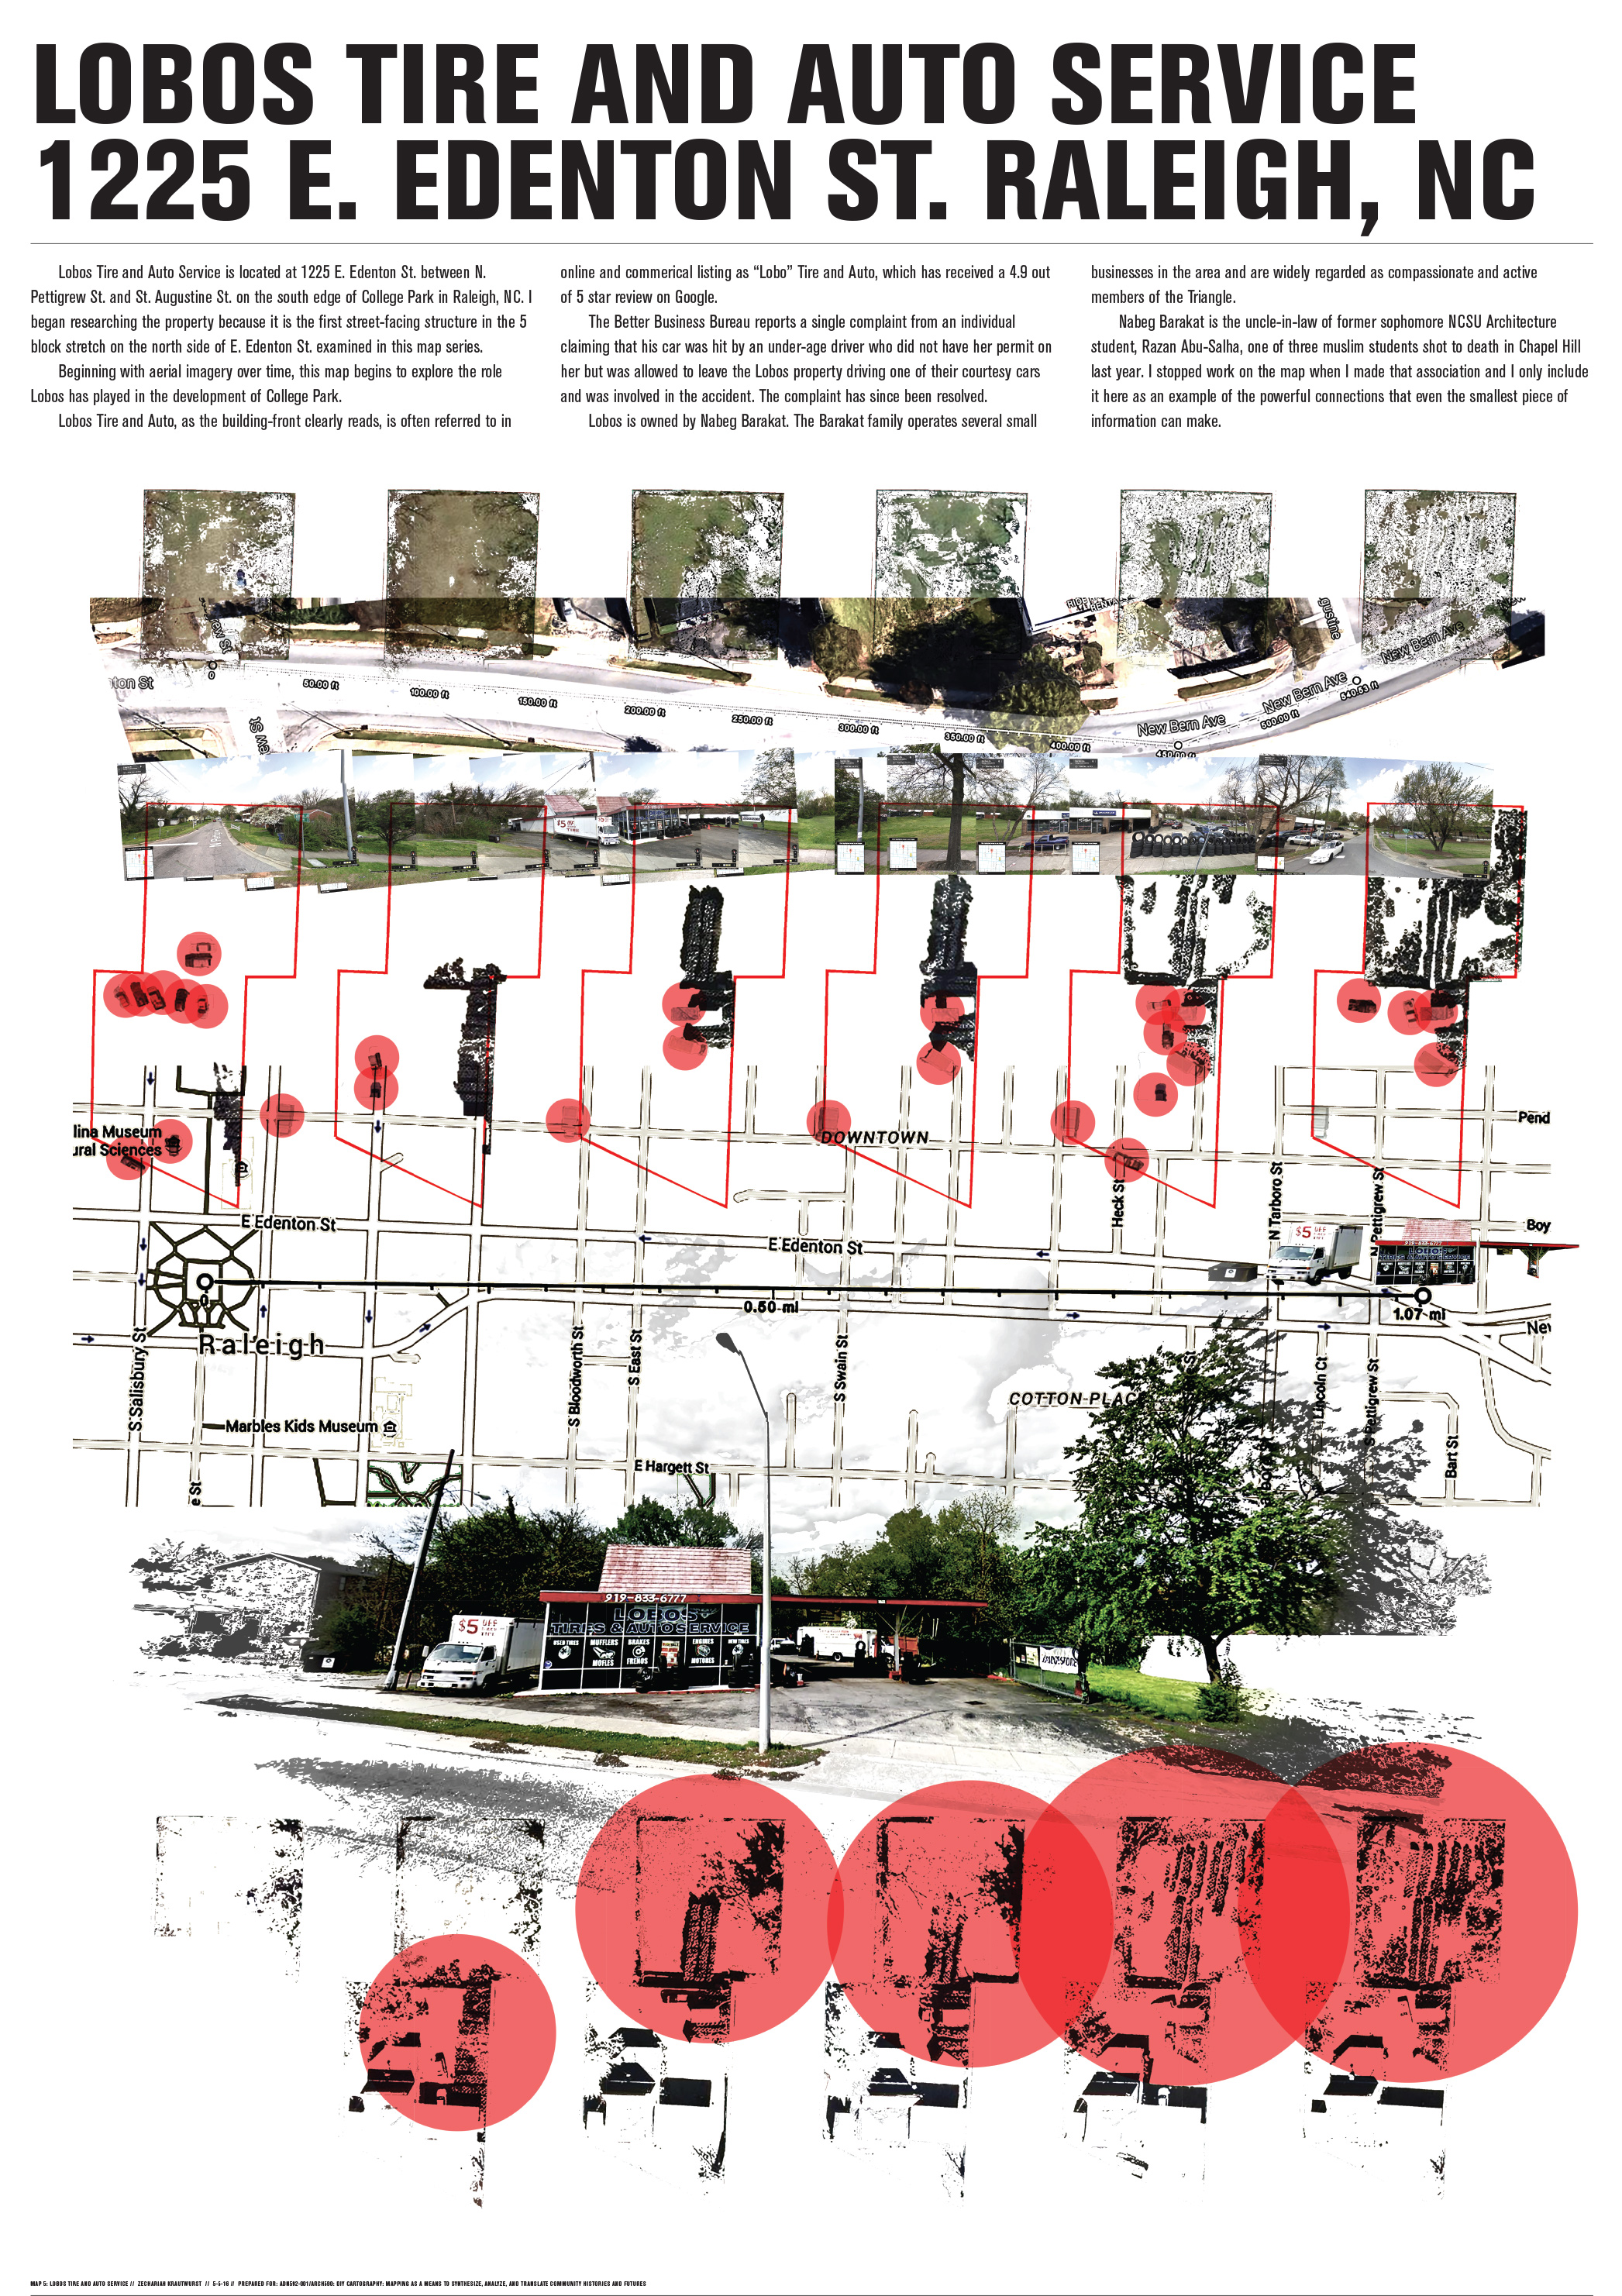
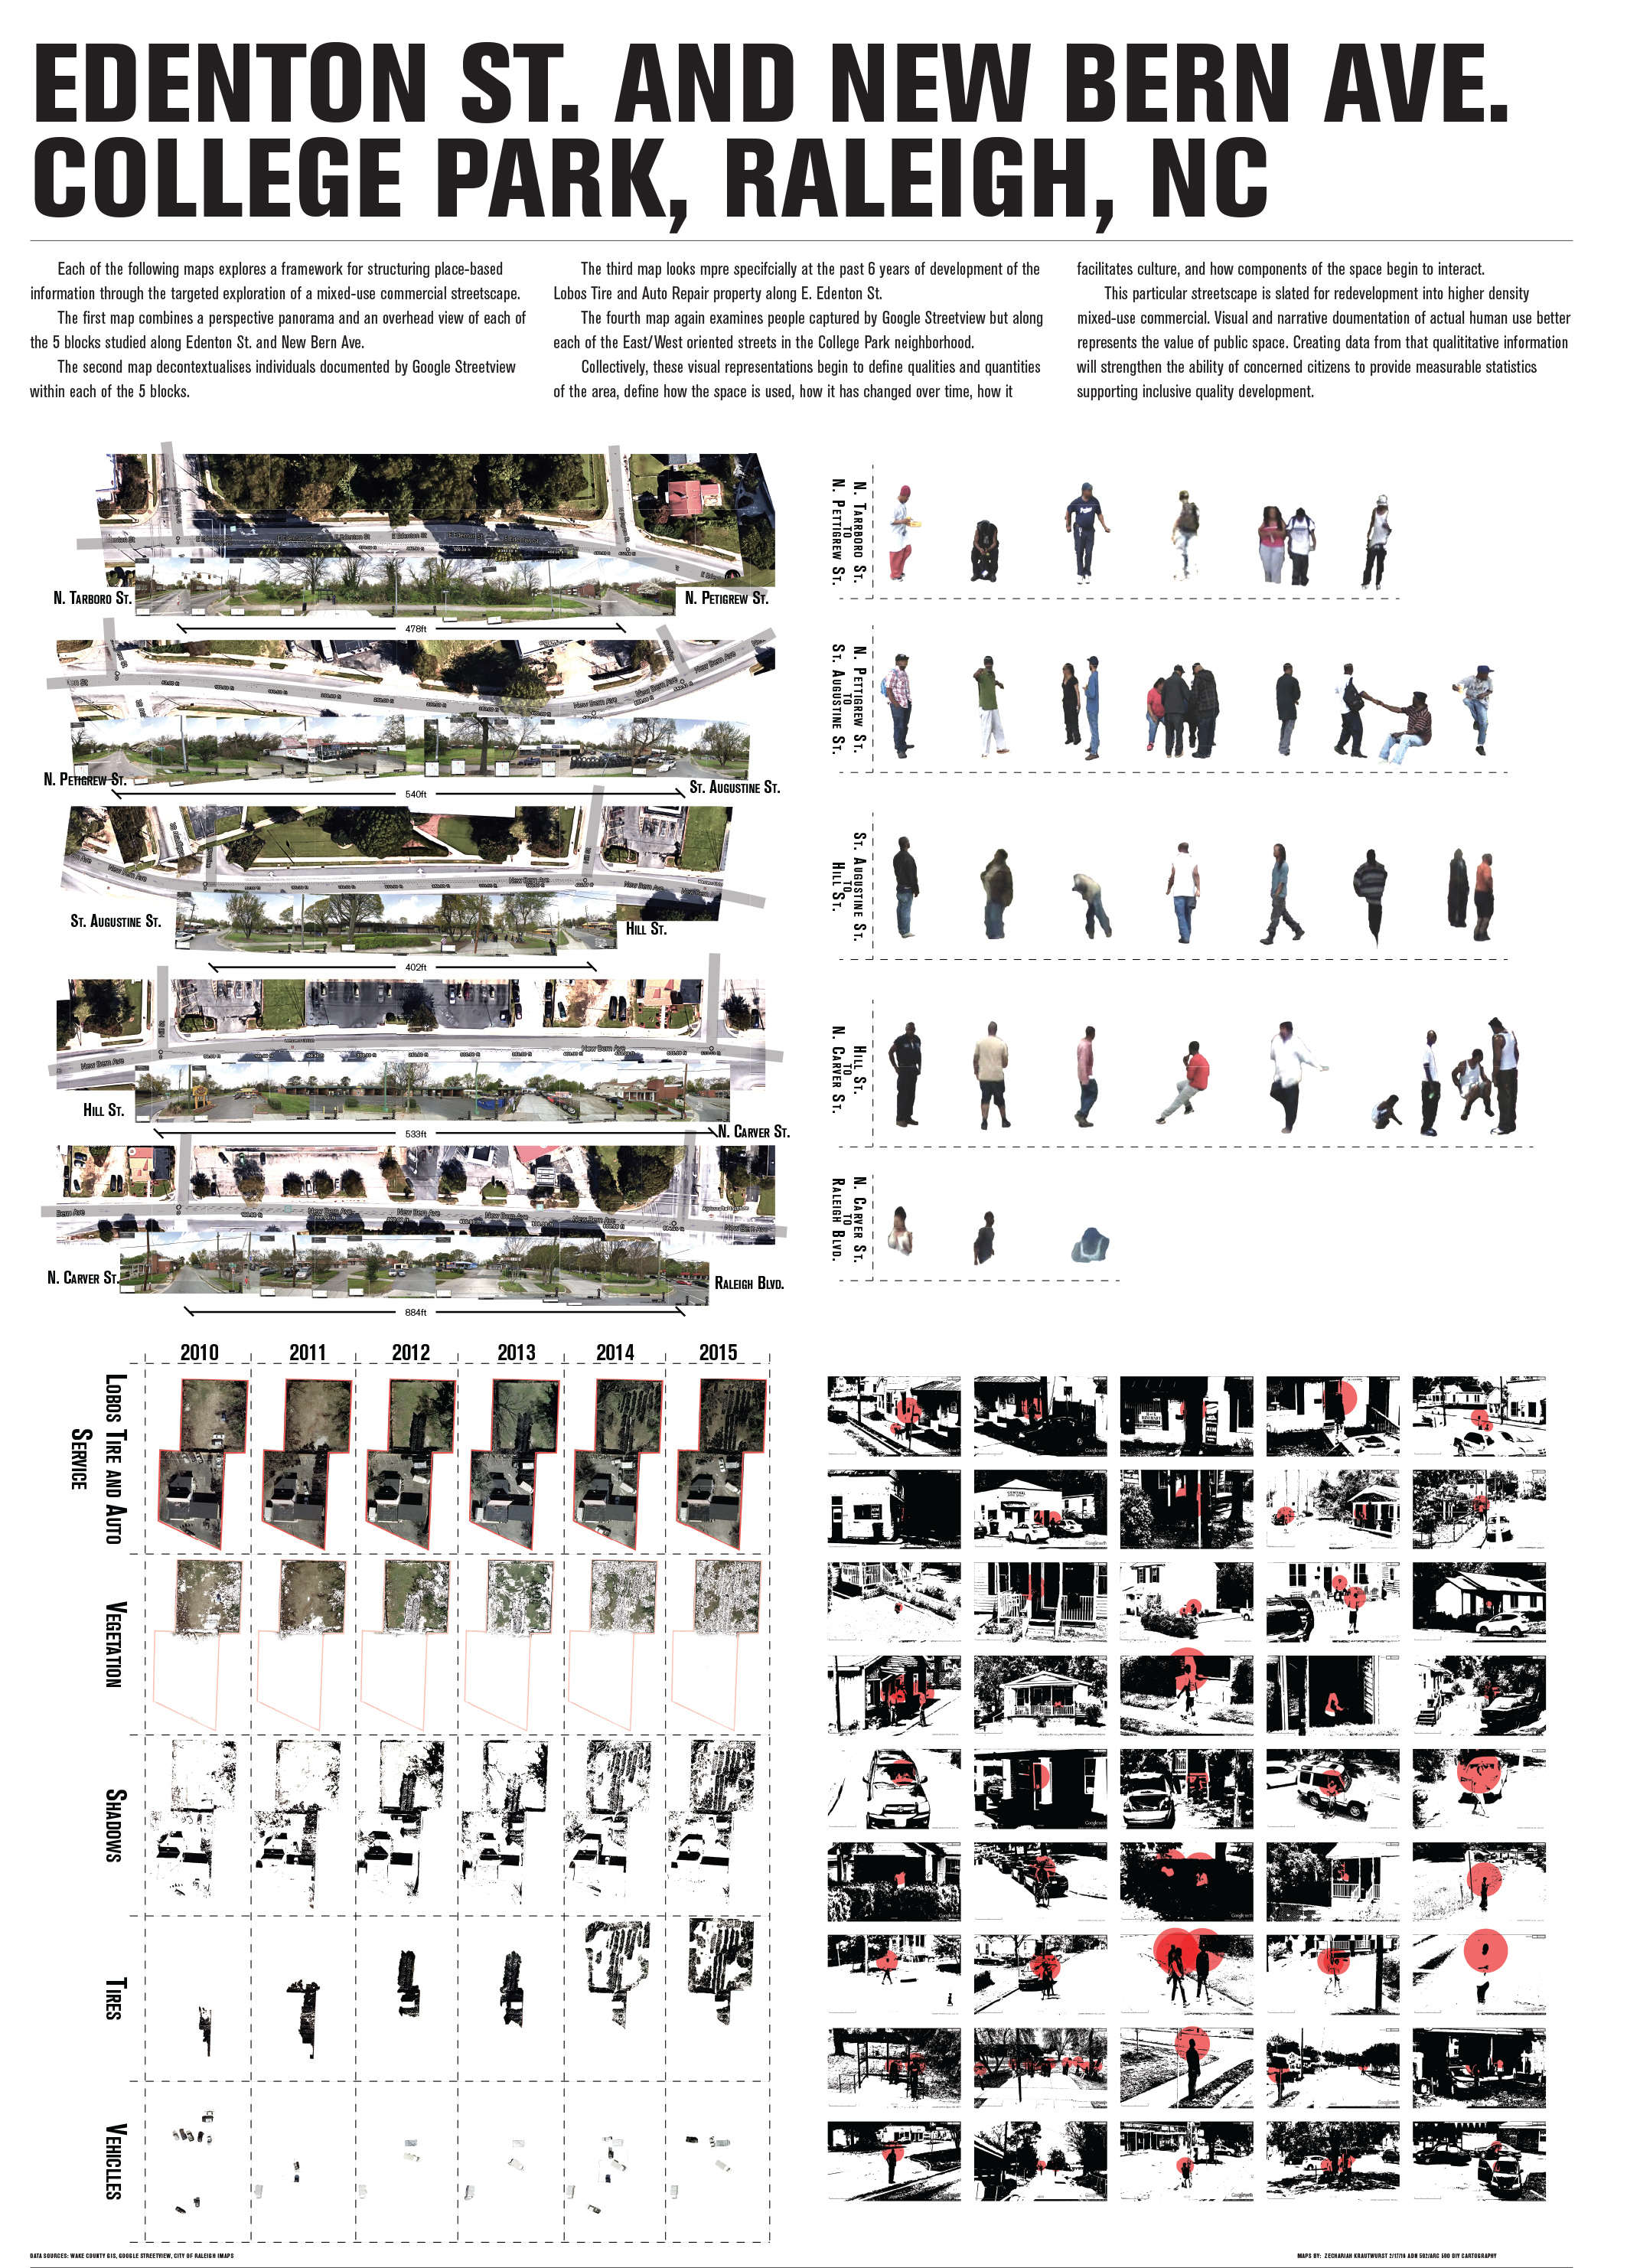
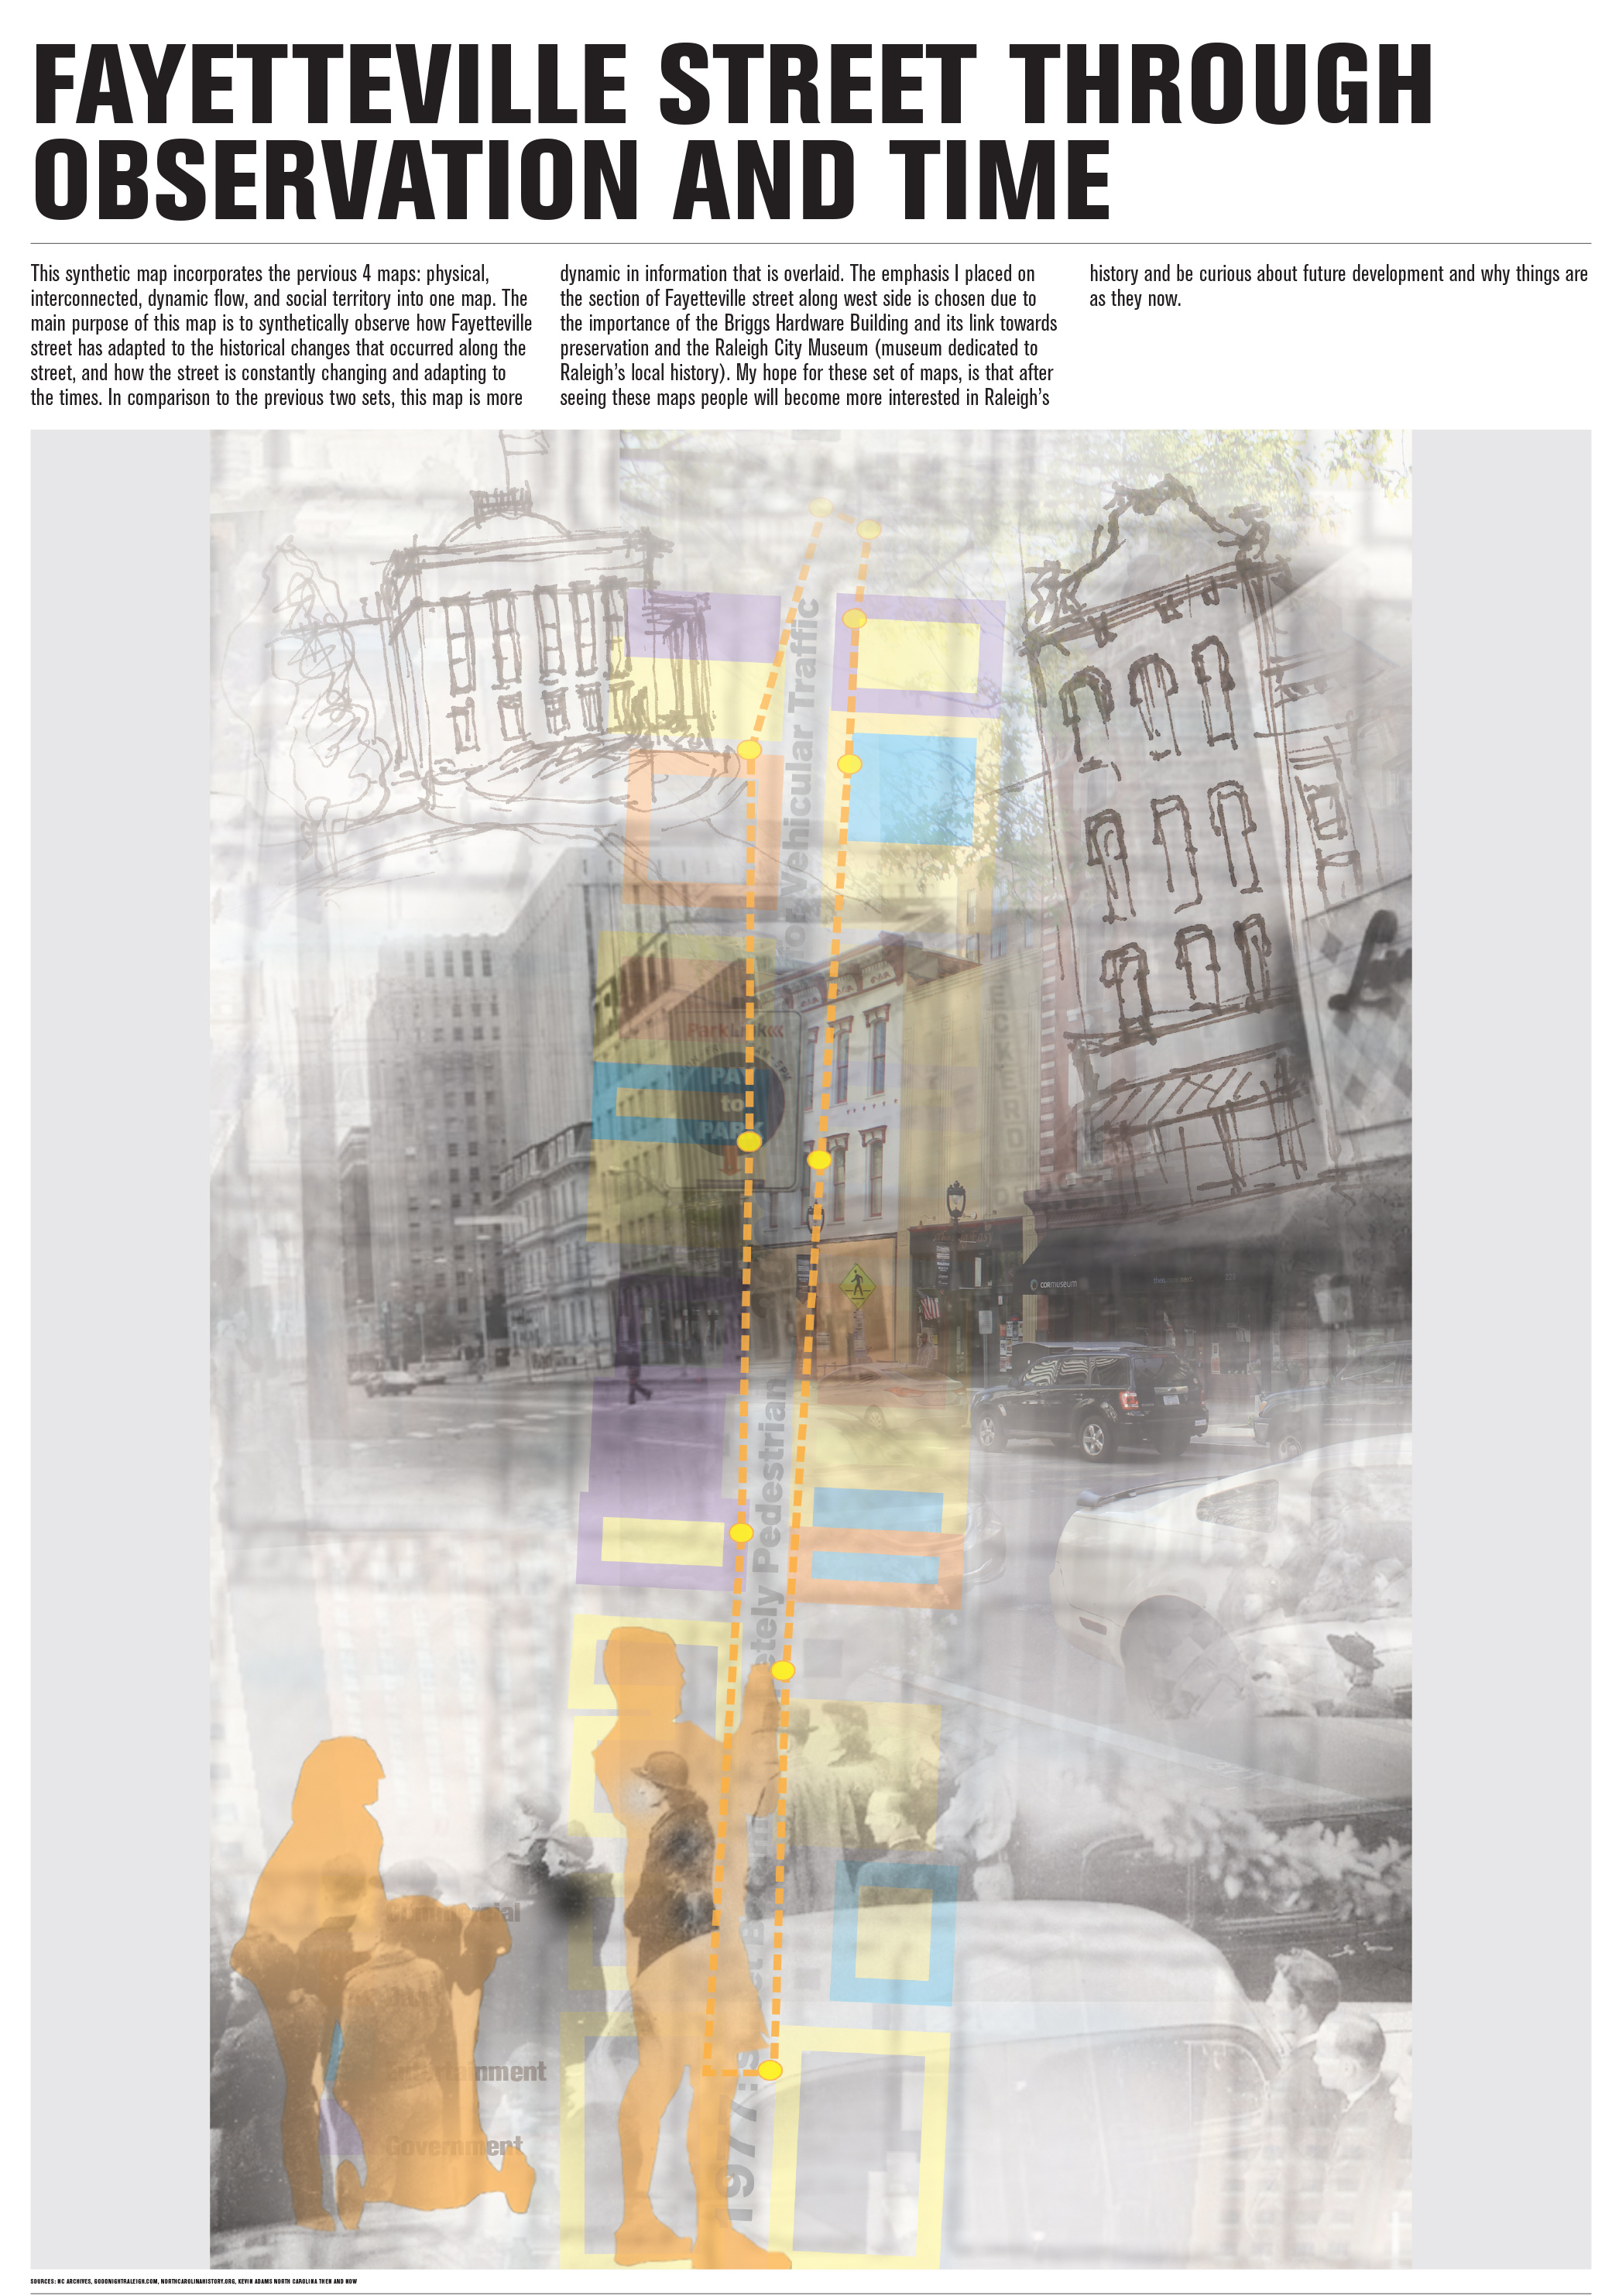
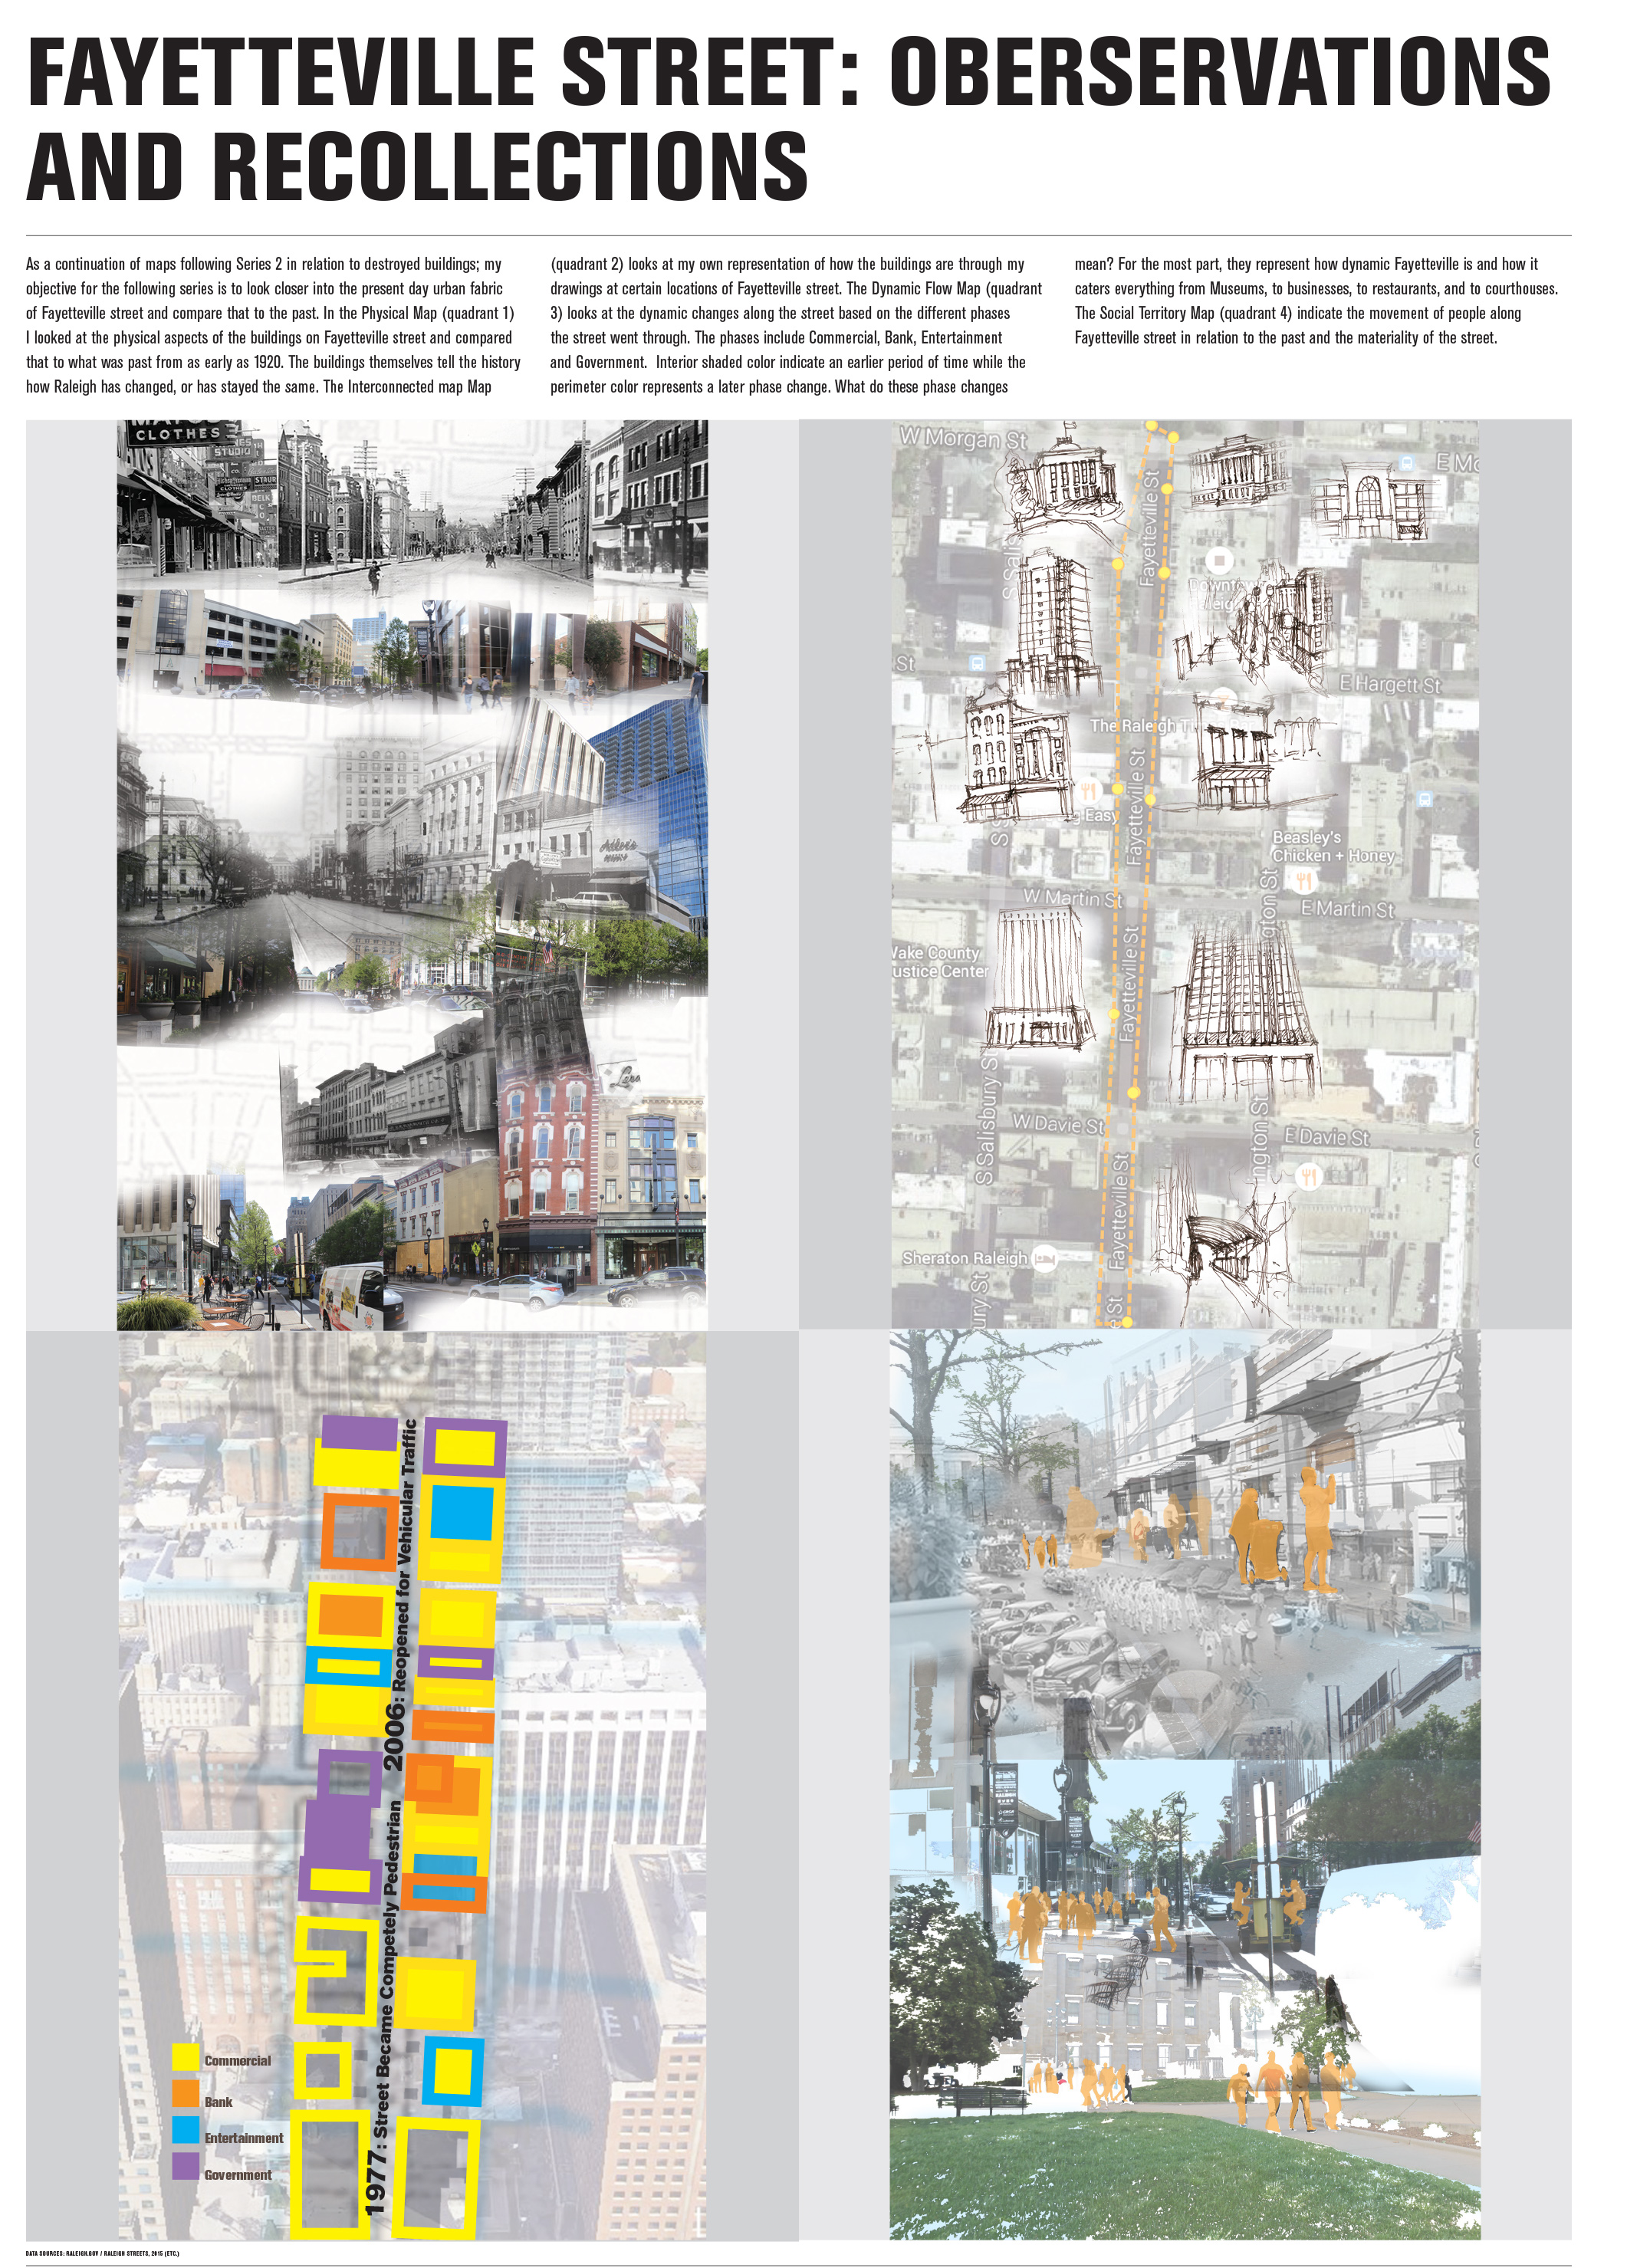
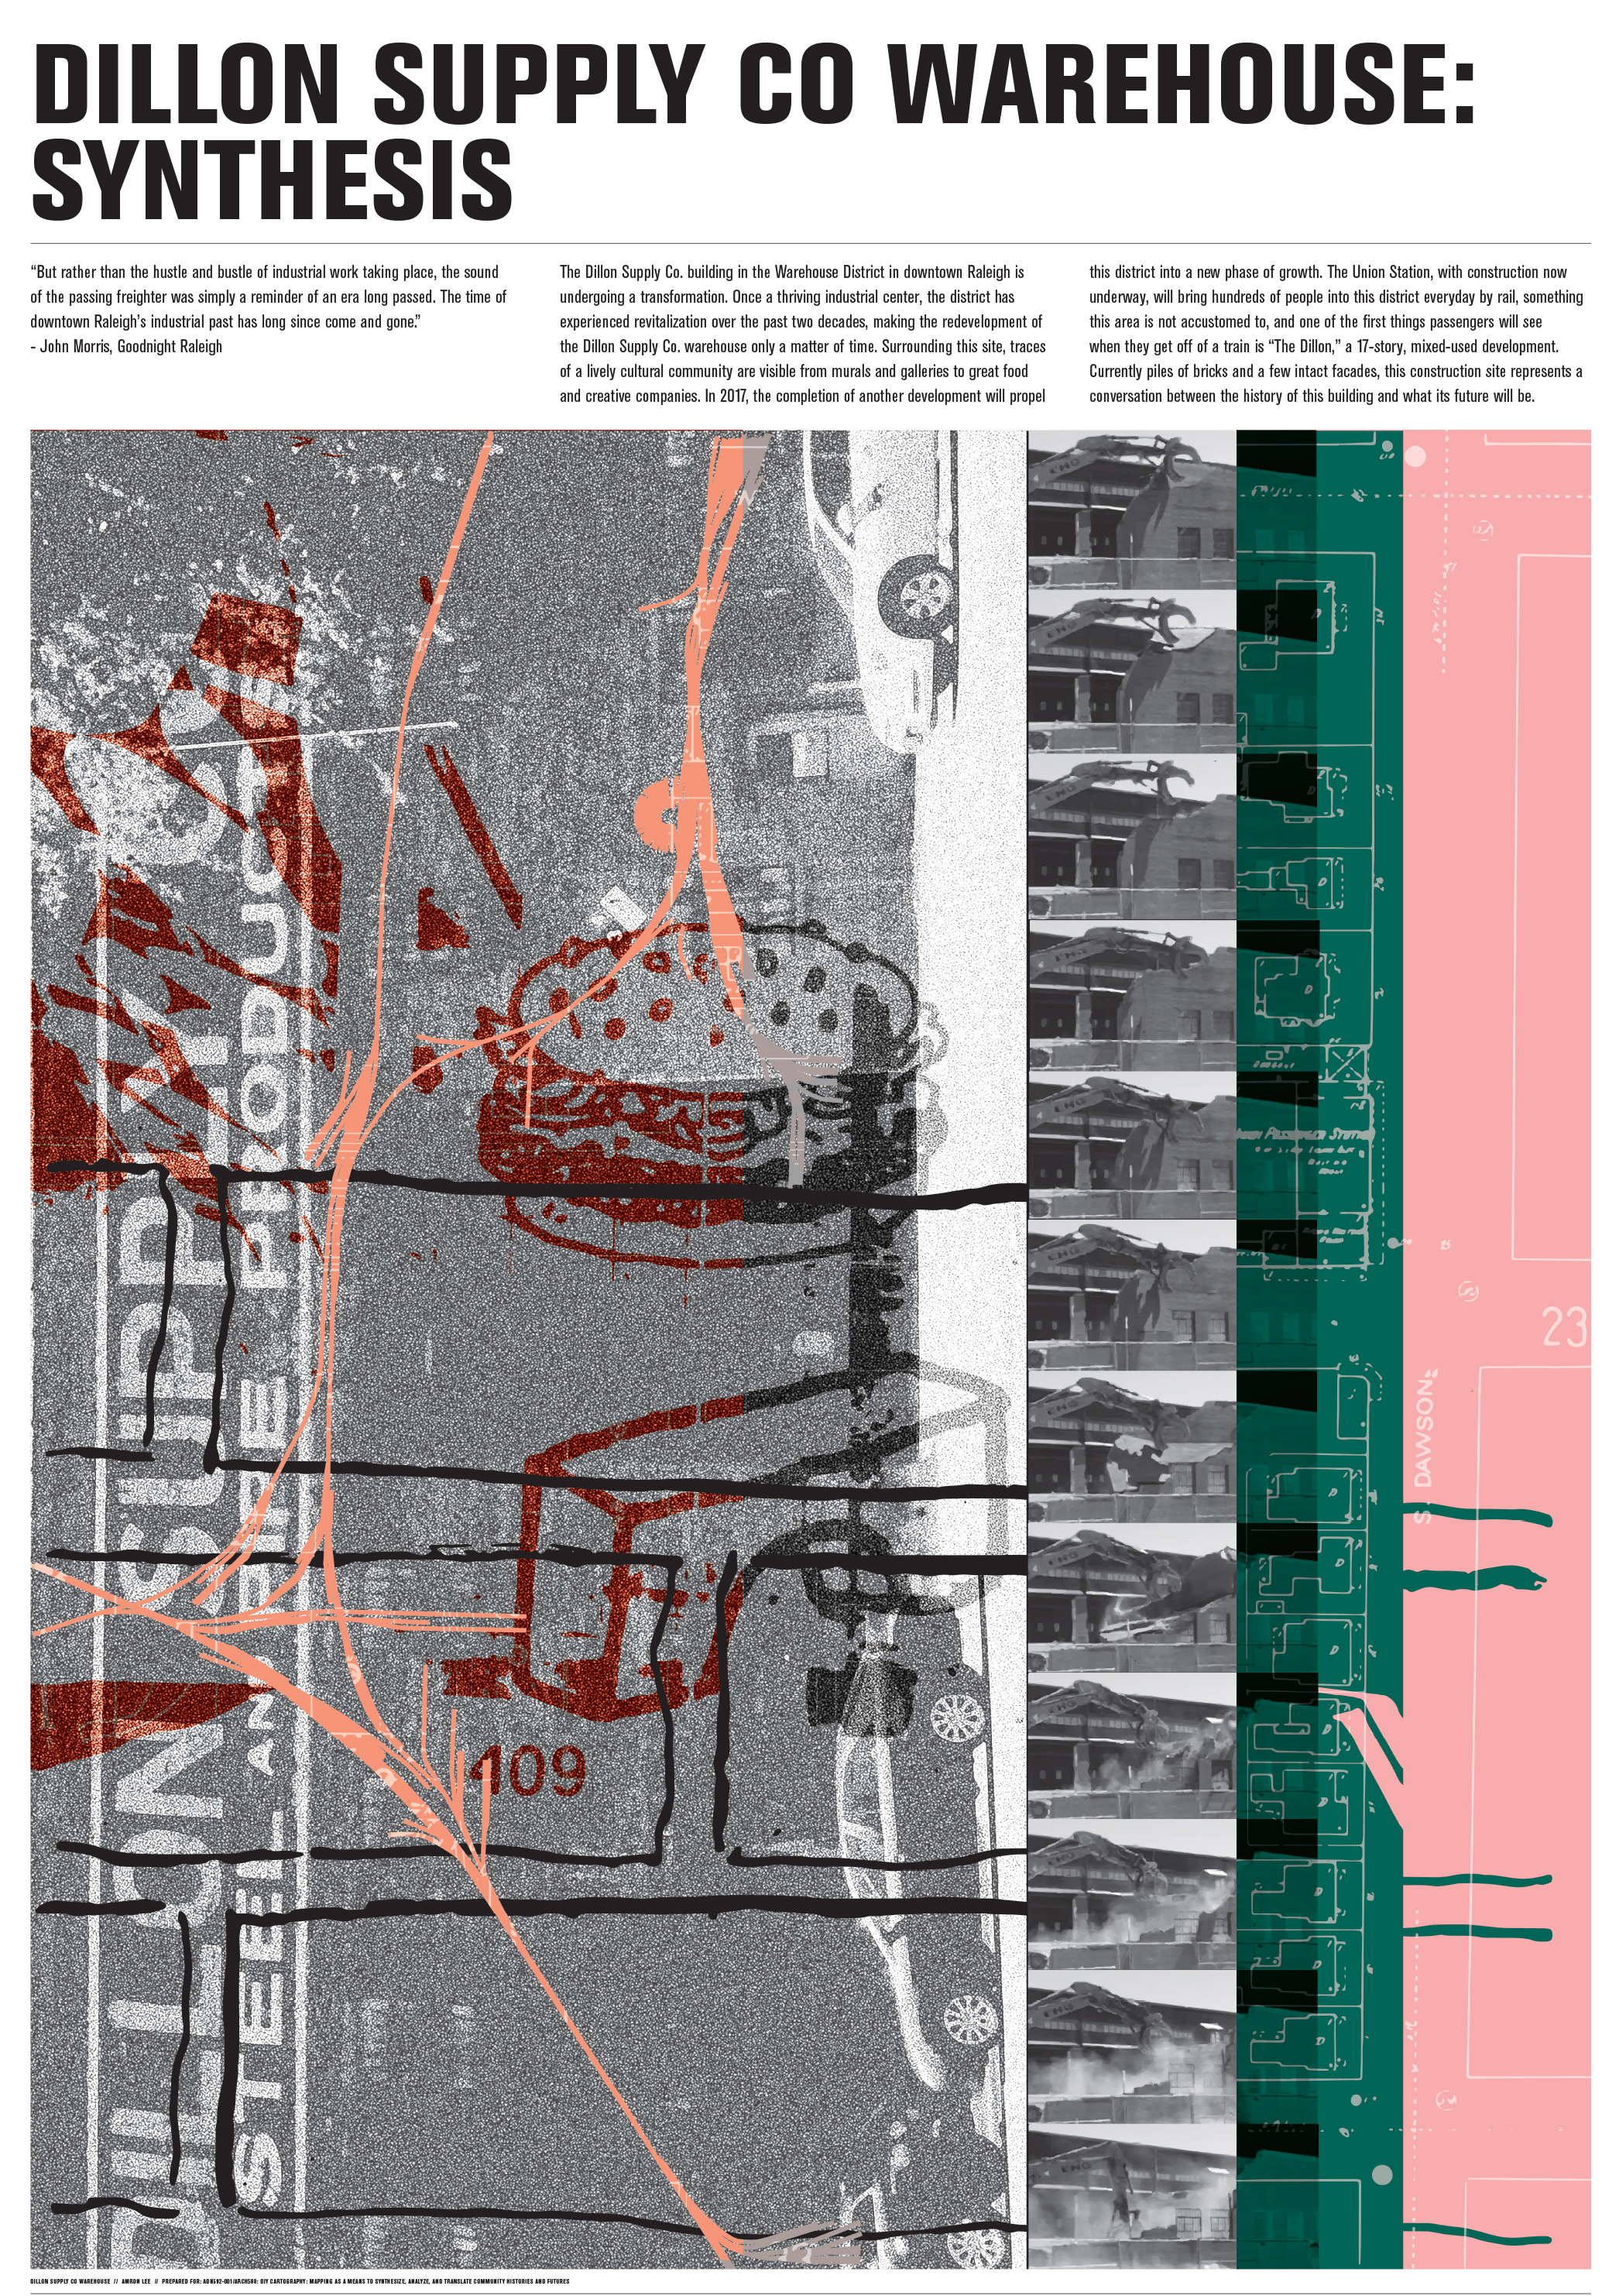
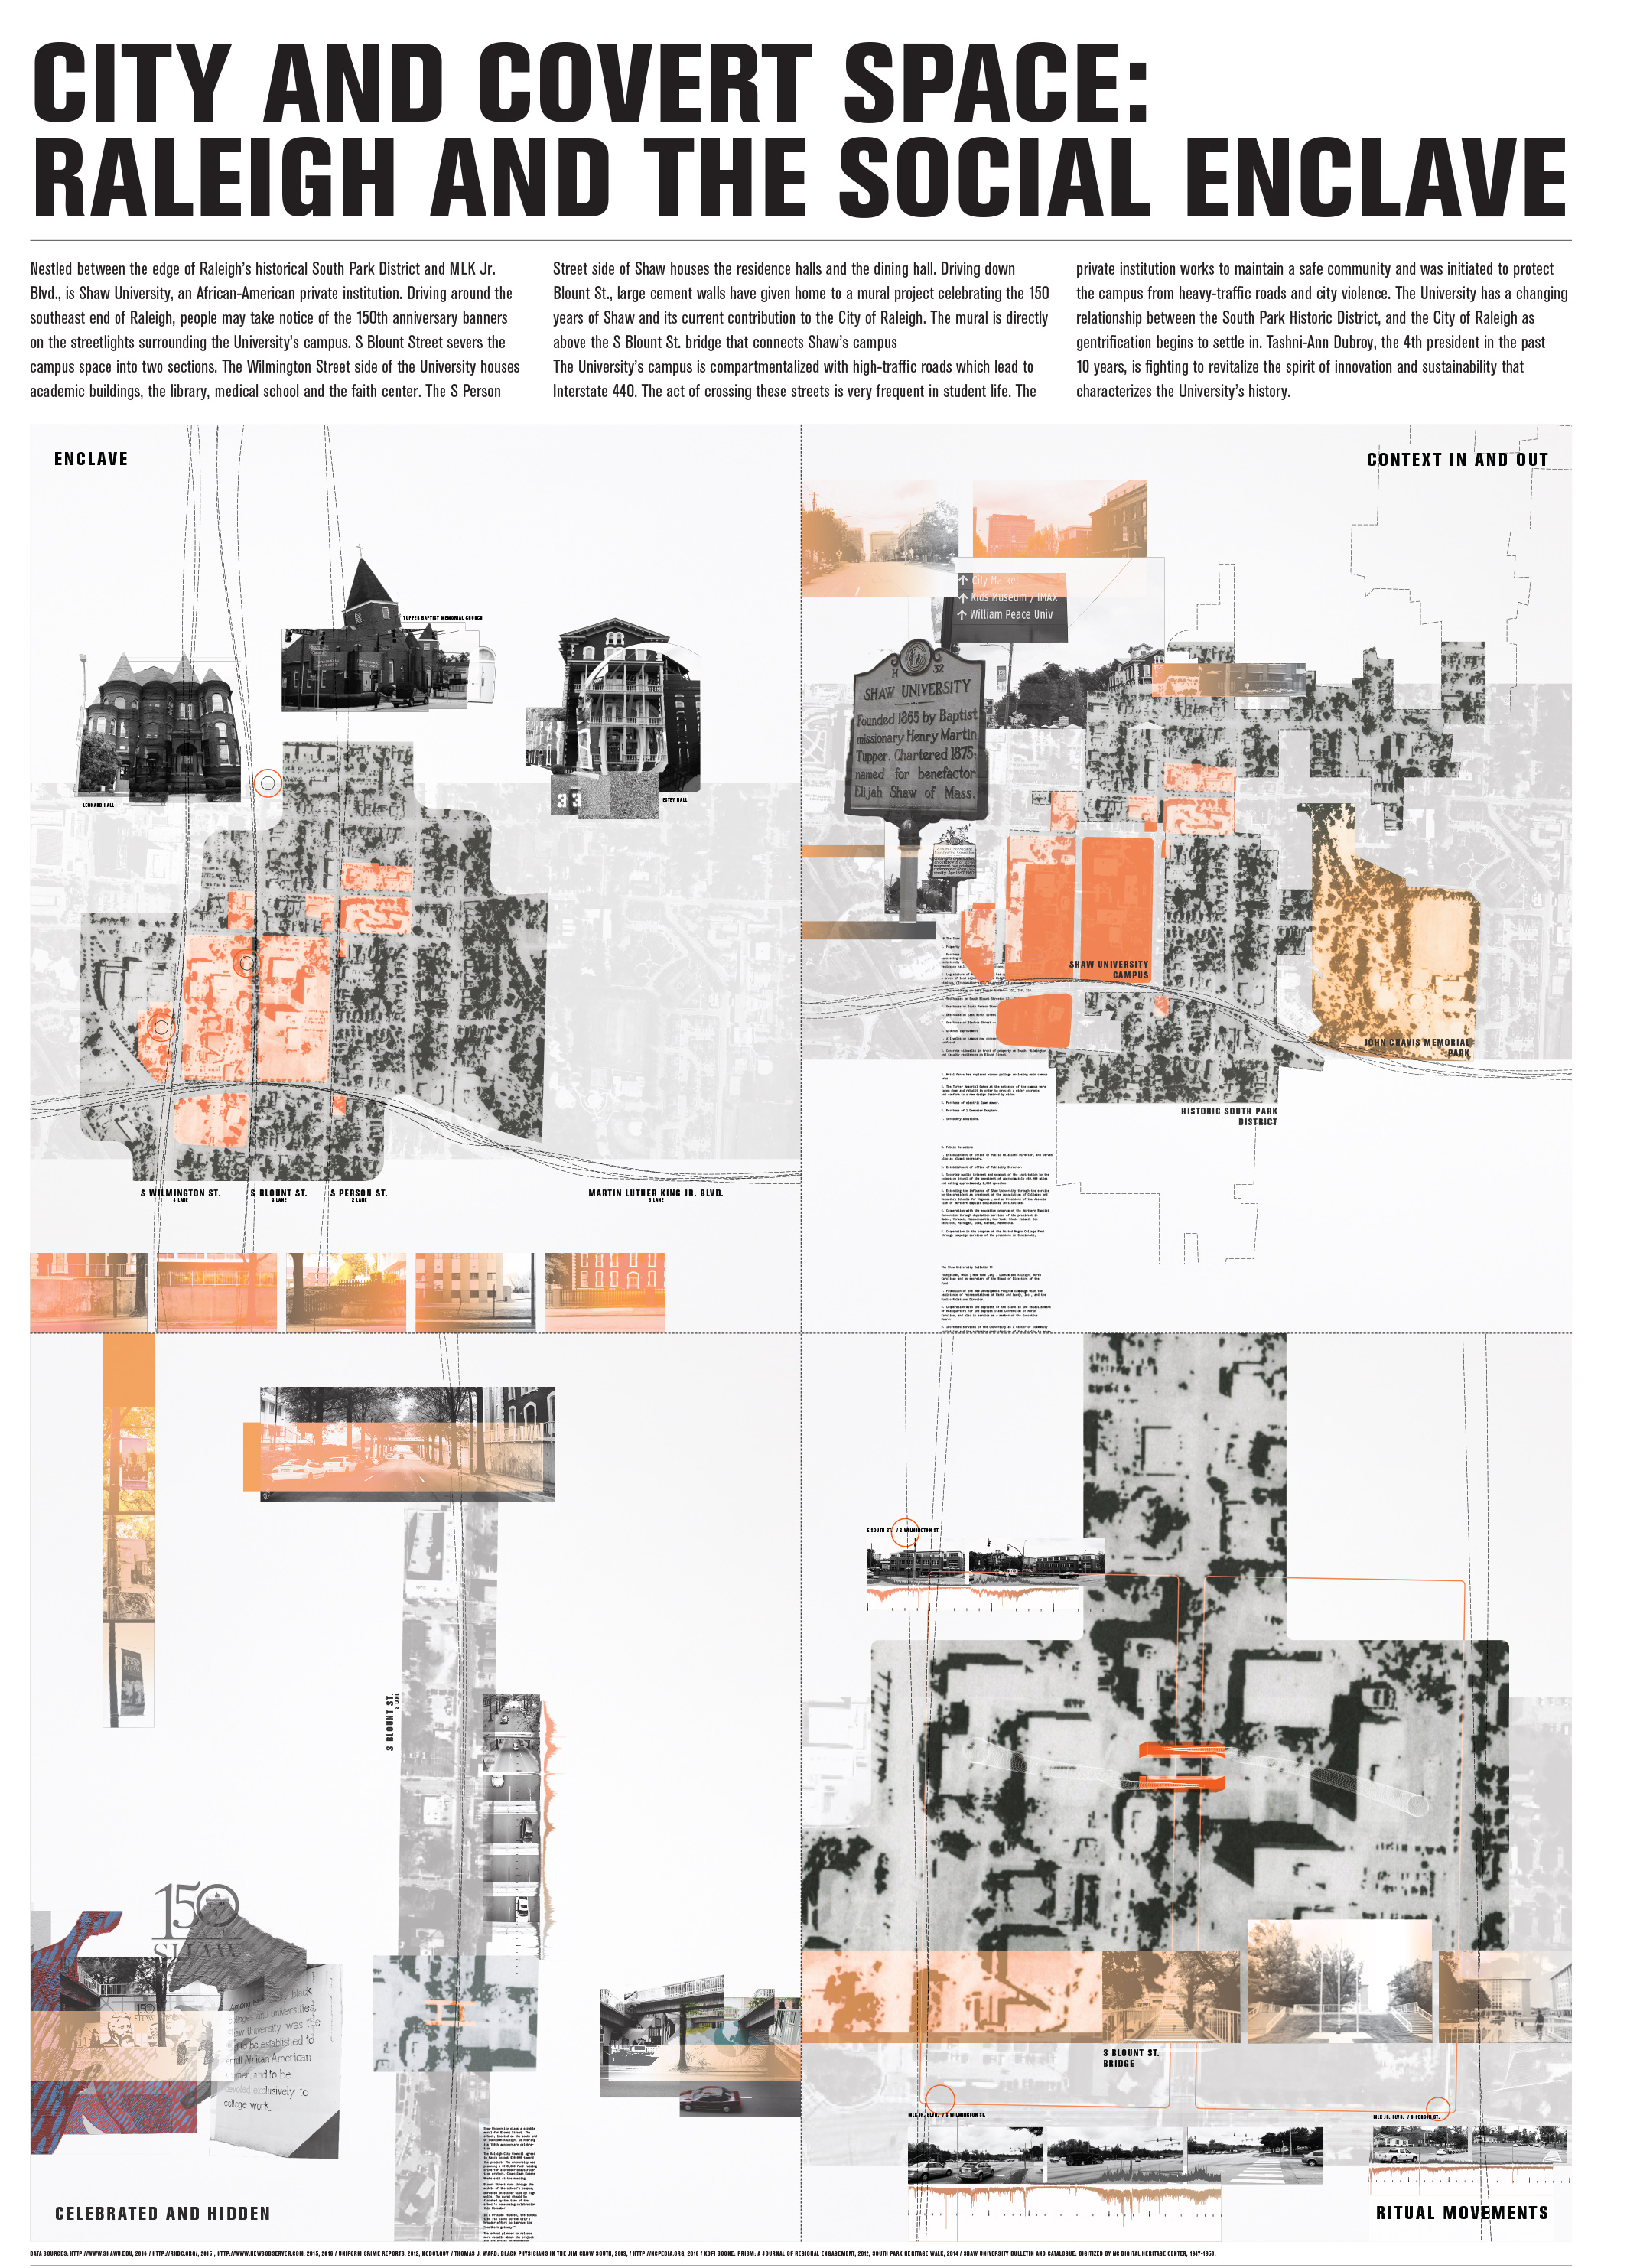
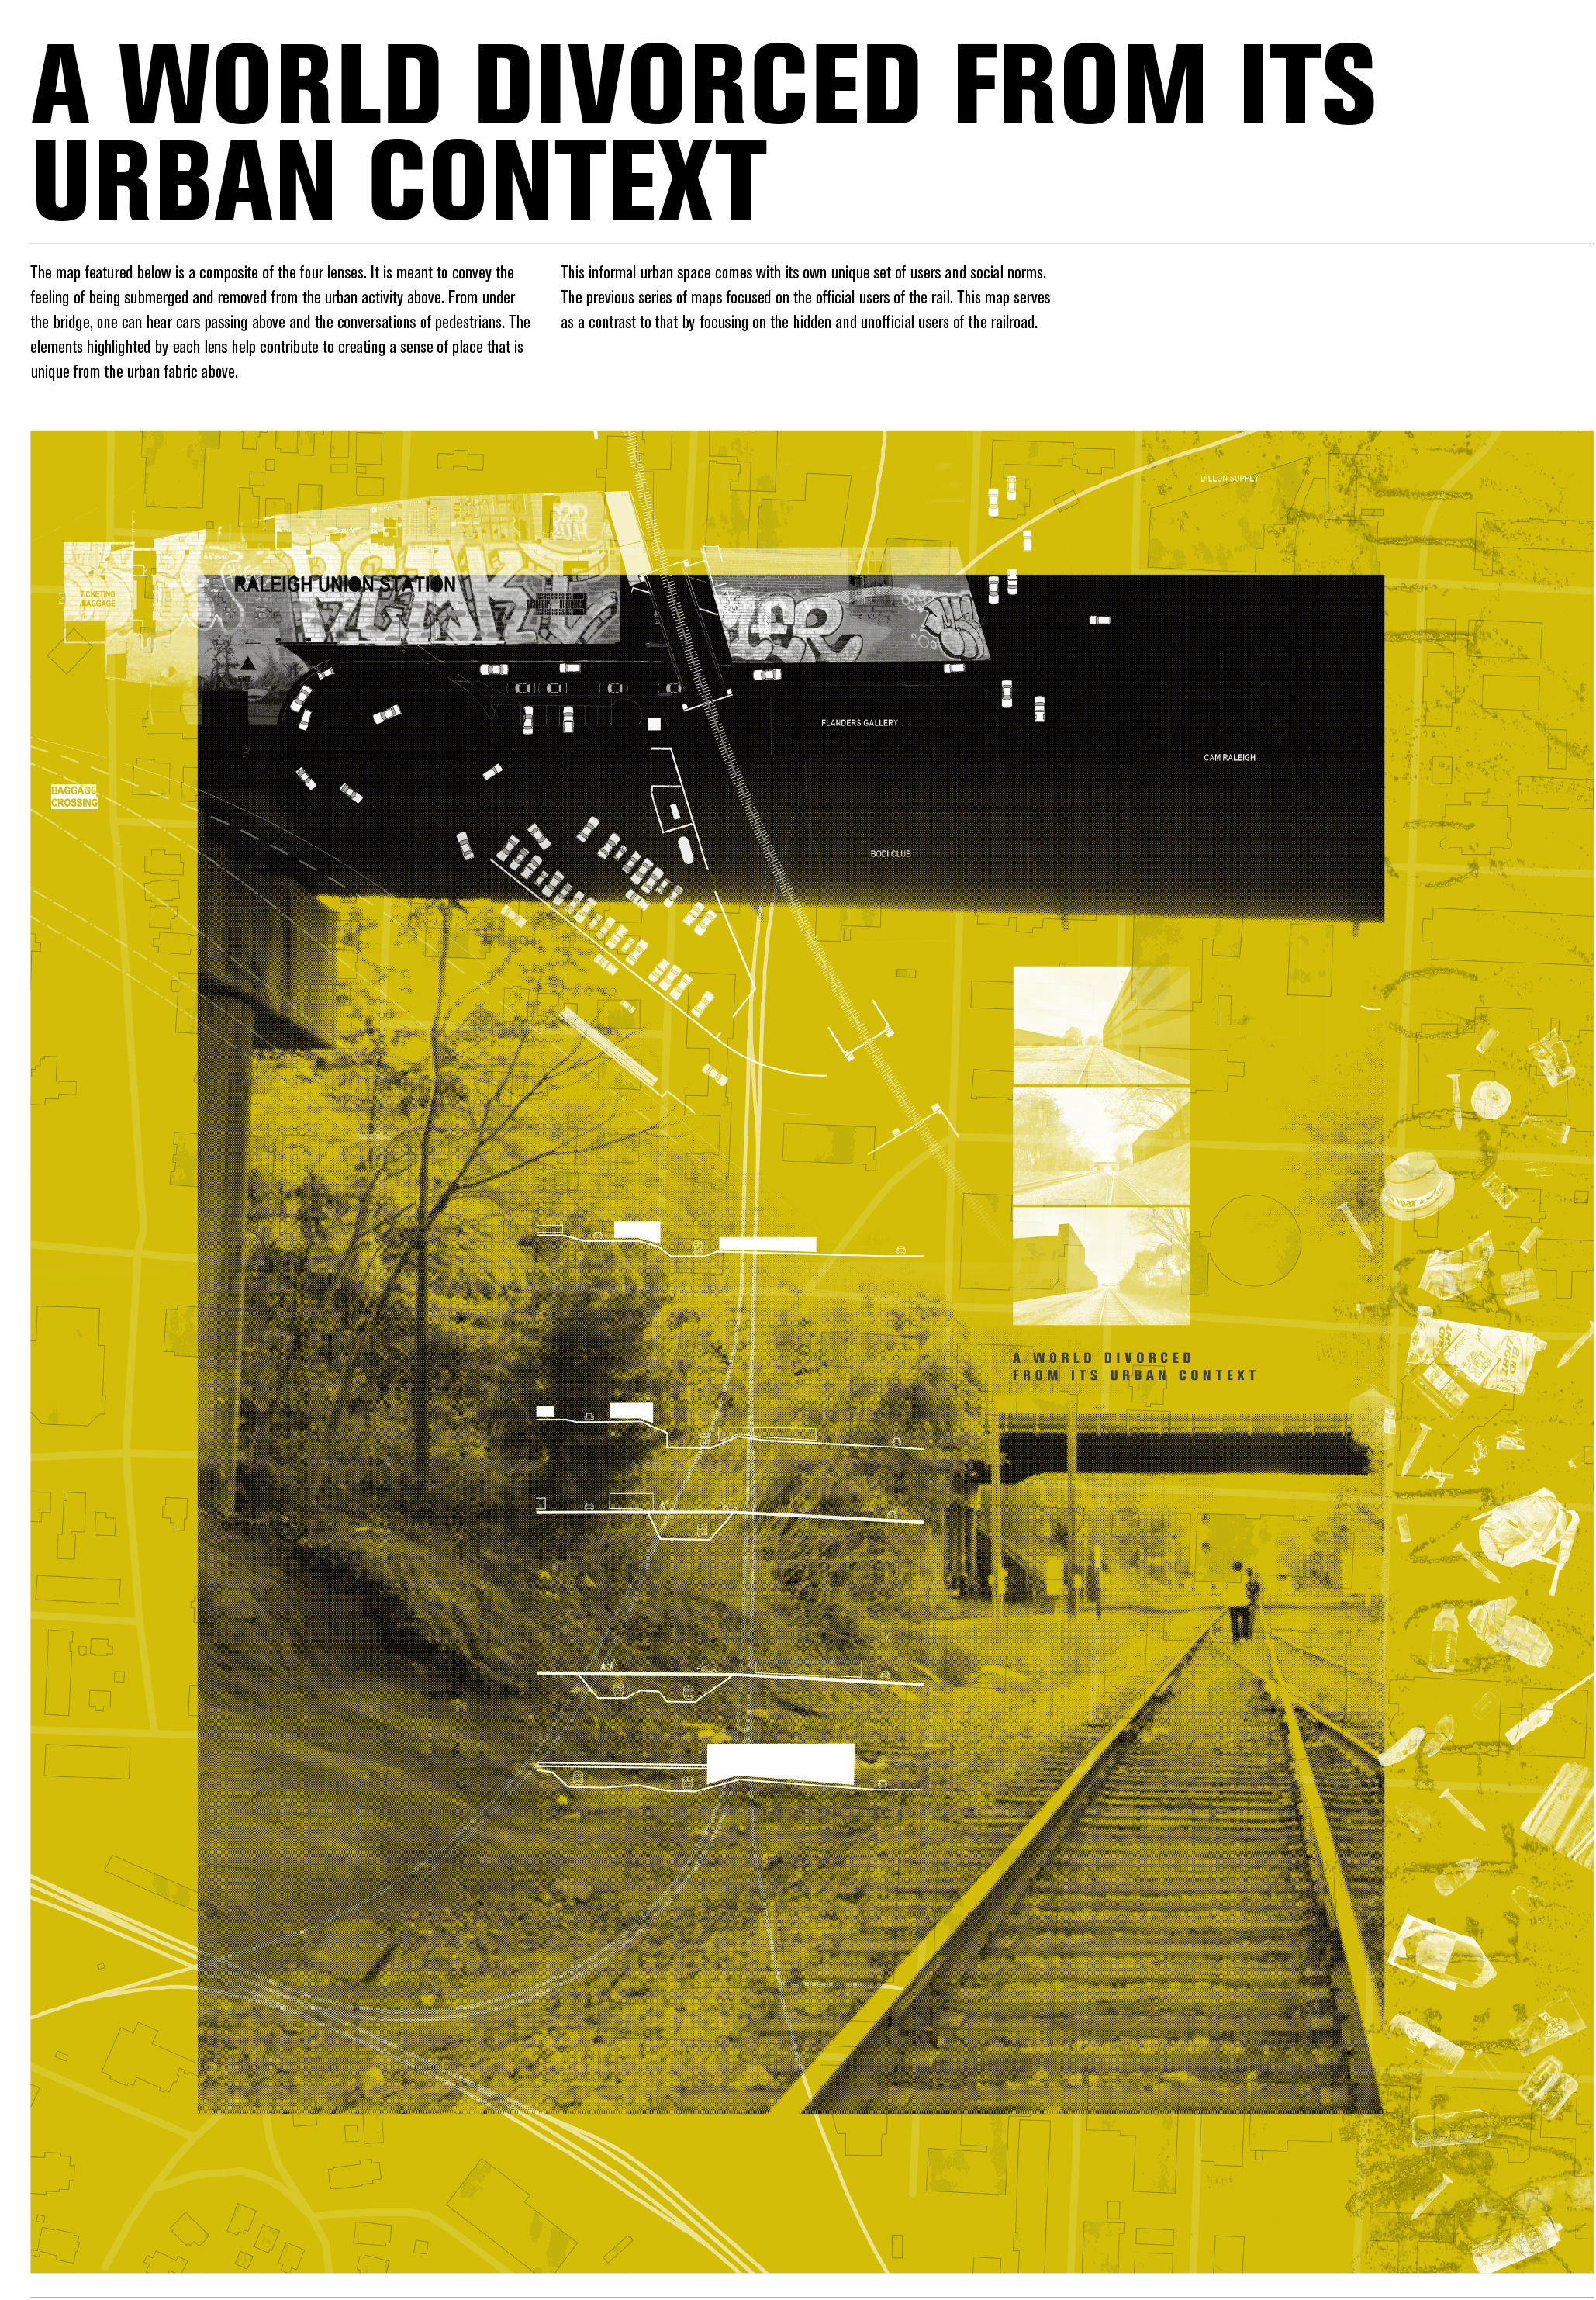
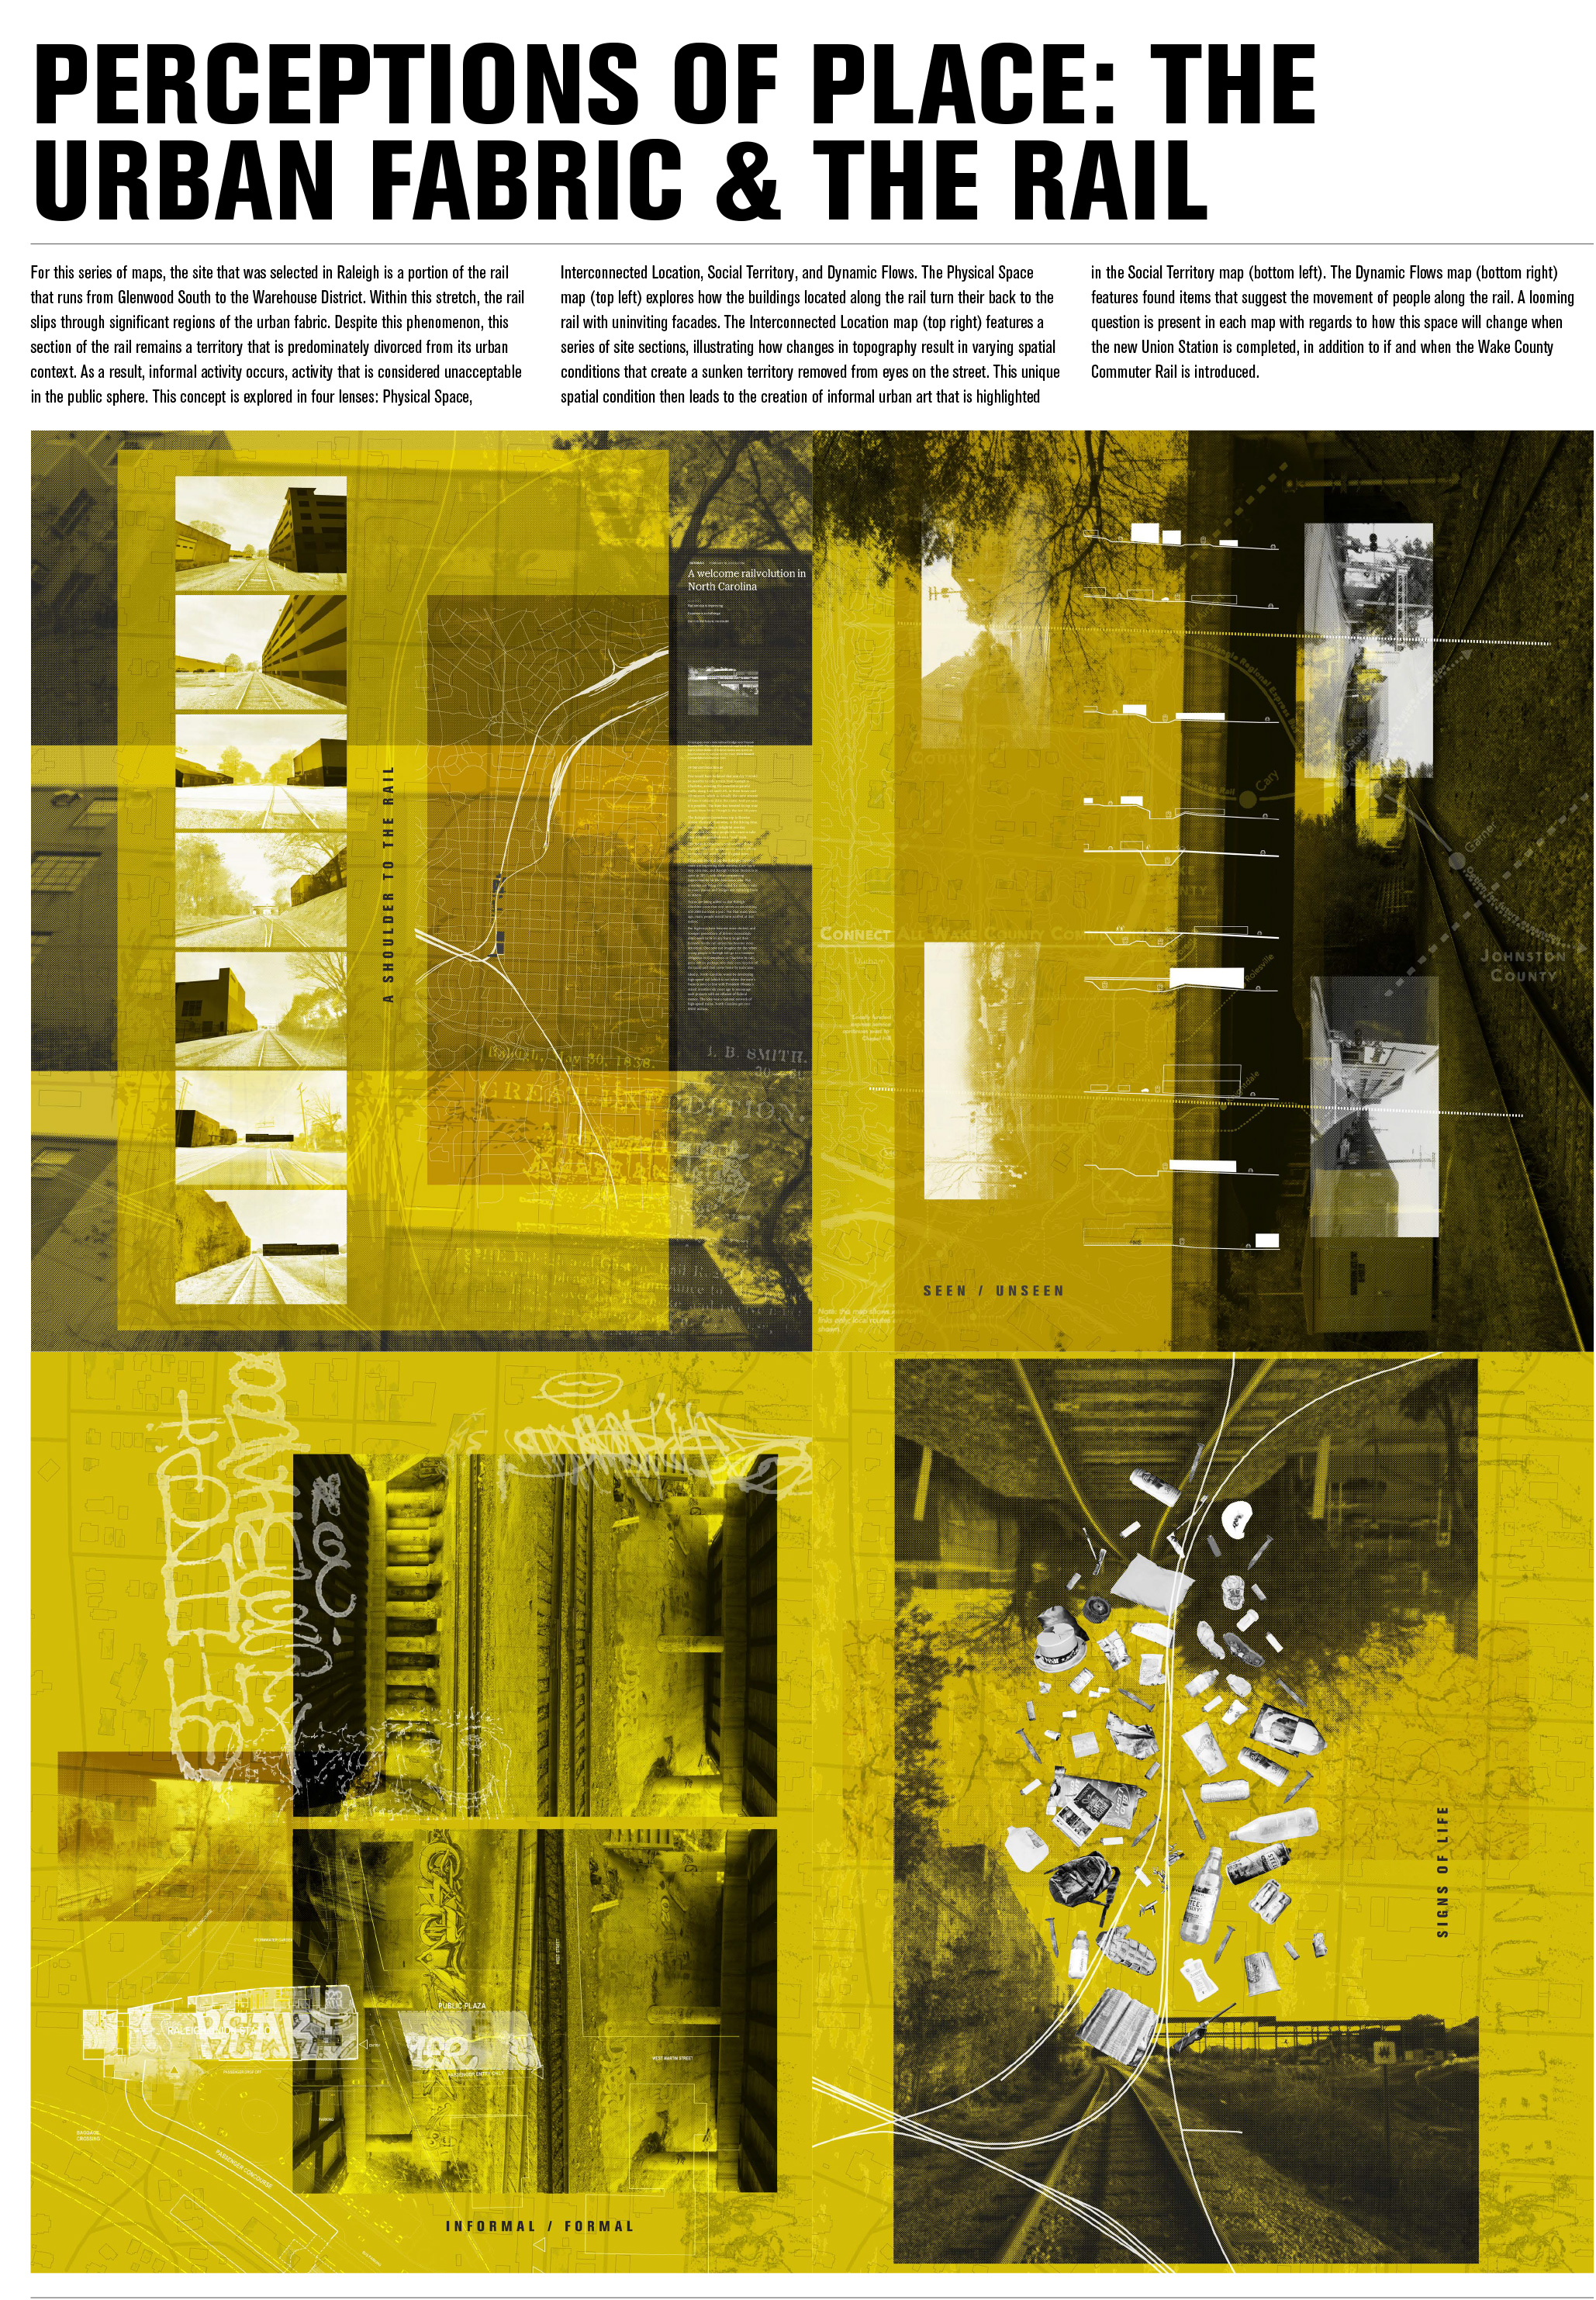
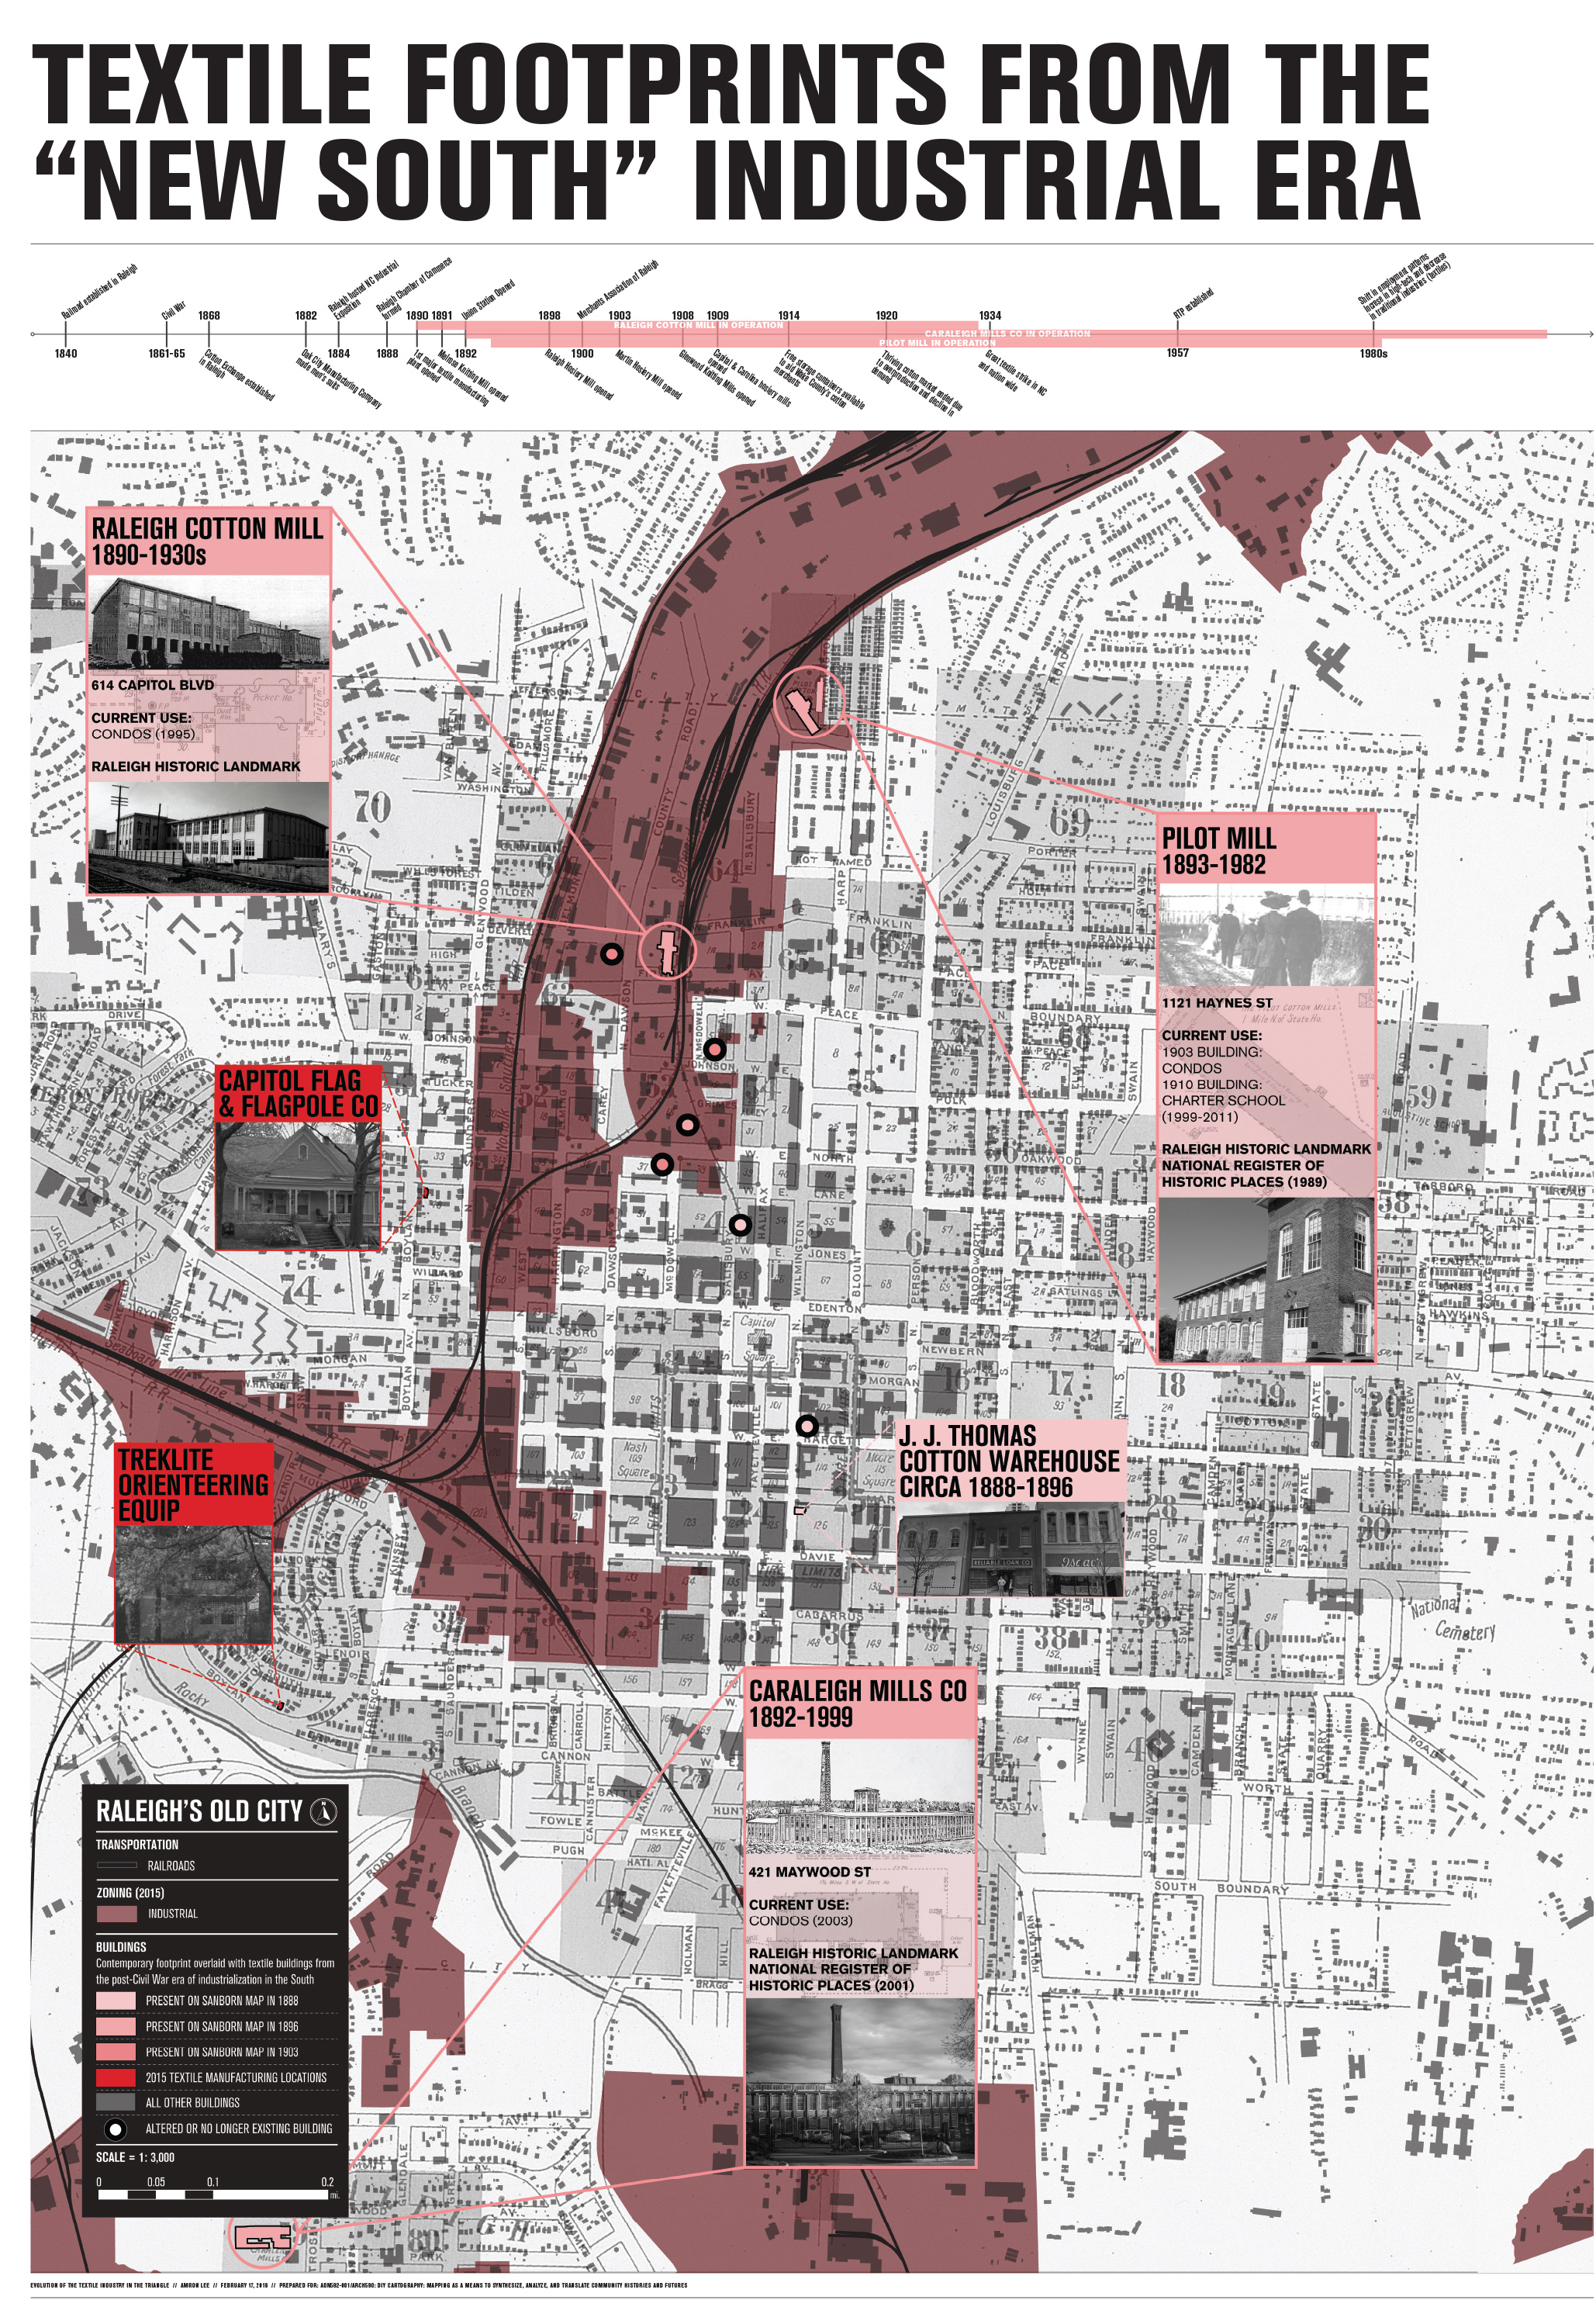
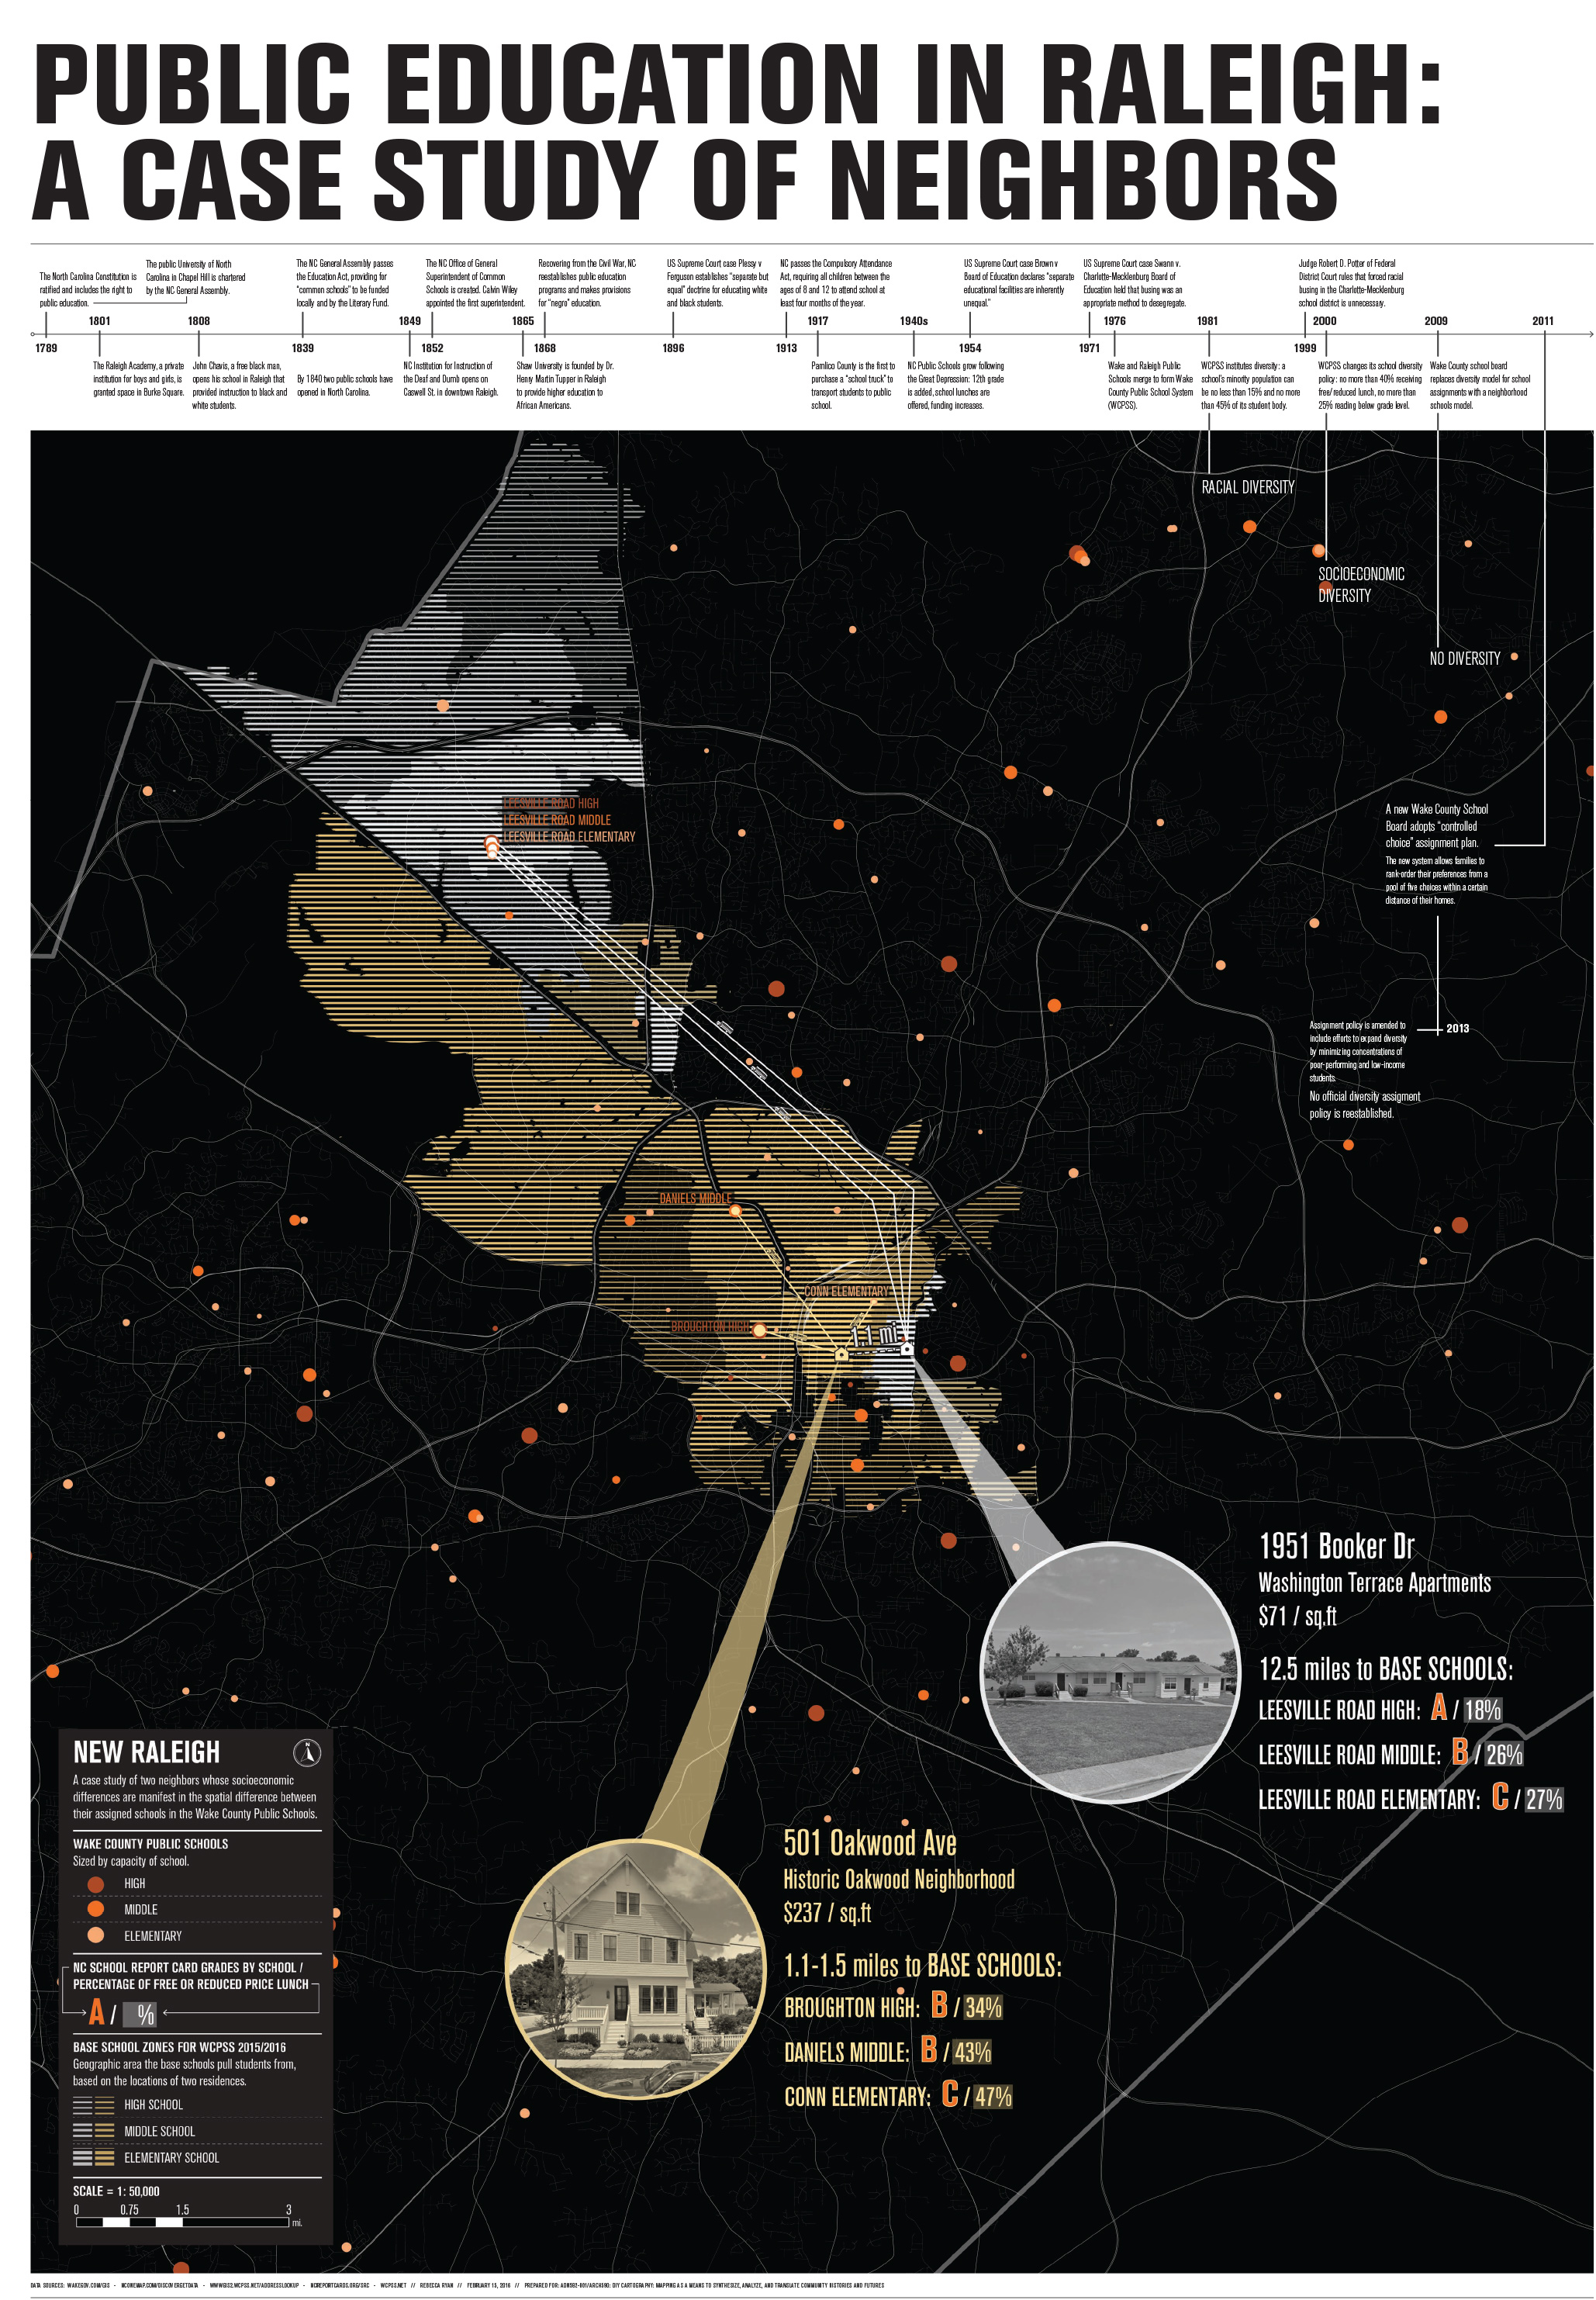
MAP SERIES 03: TESTING THEORIES THROUGH OBSERVATIONAL MAPPING
Research Methodology: Mixed Methods (Observational and Participatory Research)
Mapping Methodology: Narrative Mapping
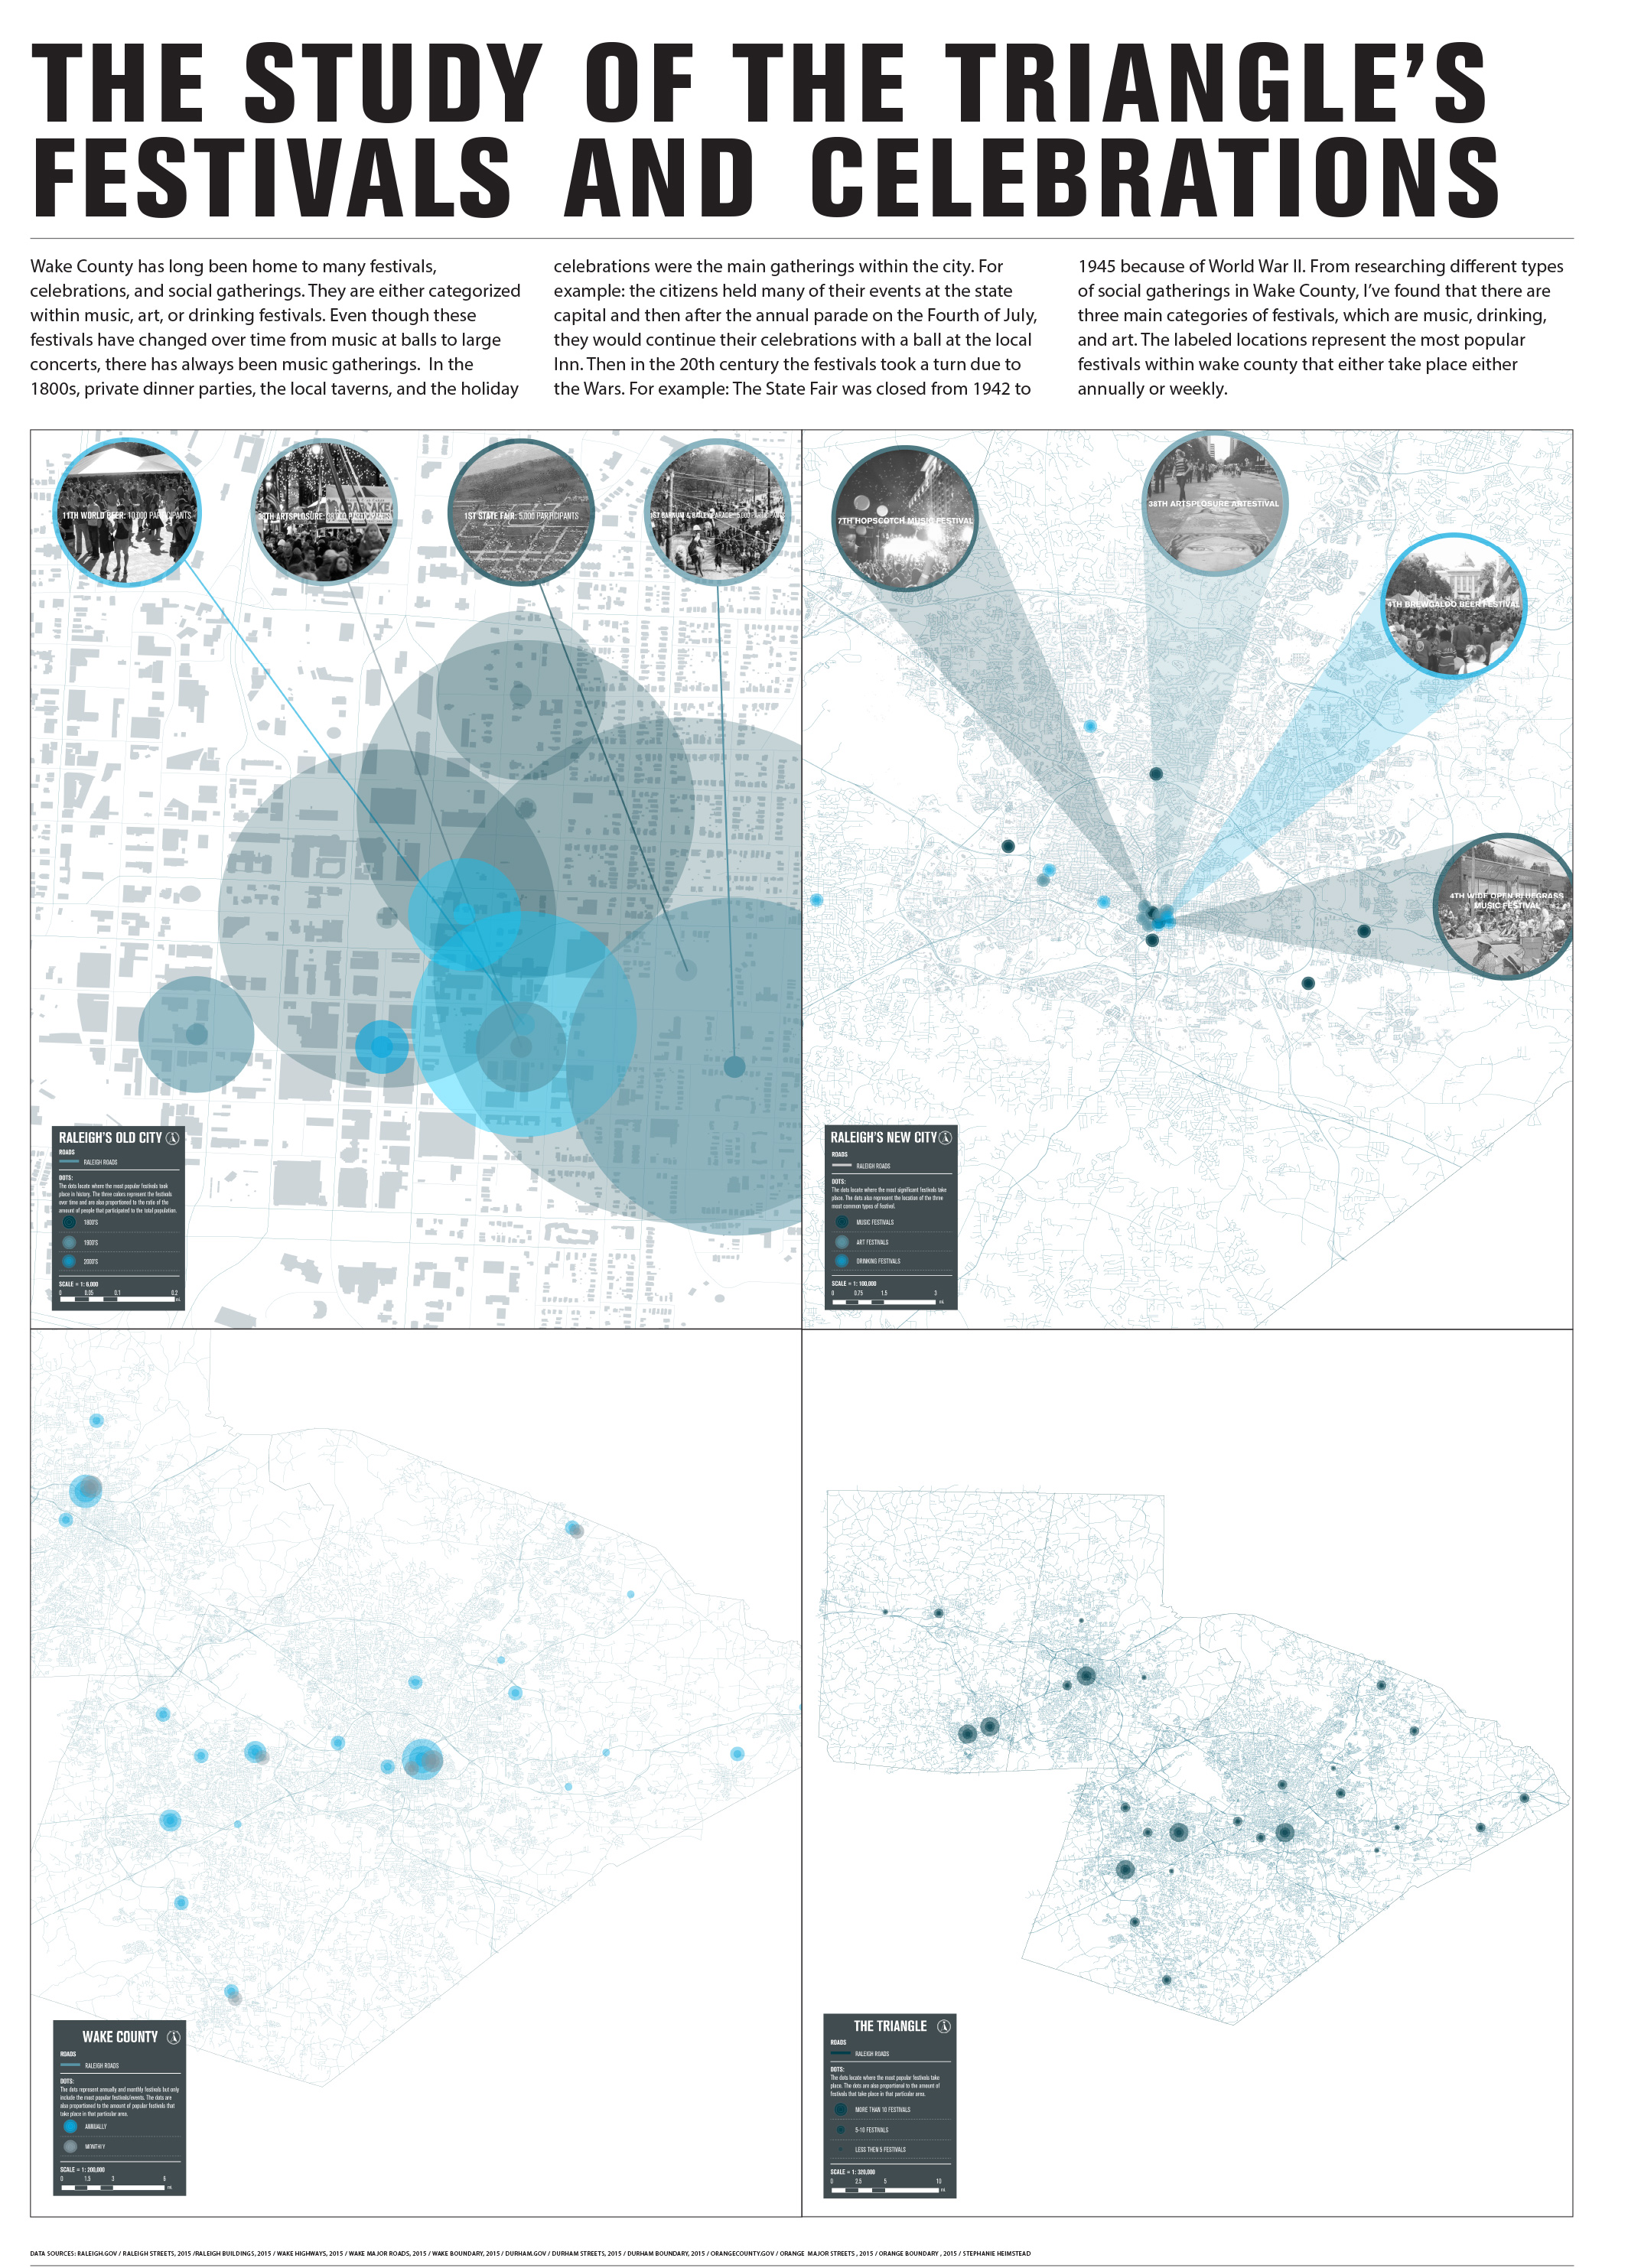
Students visited an identified site/area based on findings from previous maps and create a map (ala Nolli Map) that recorded their data. The goal of this map was to (1) test the theories and claims put forth in the previous maps and (2) find new patterns and relationships from the physical world and (3) include a survey or participatory component to collect new data.