This advanced-level undergraduate and graduate course looks at techniques of mapping and information visualization to gather, display and understand design-based research topics.
Using both quantitative (statistics and numbers) as well as qualitative (observation and interpretation) methods of data gathering and presentation, students analyze the visualization of information from various perspectives including geography, time, and history to uncover hidden patterns and make meaning of seemingly unconnected pieces of information.
Students also learn techniques and devices commonly used in mapping and information graphics development to realize and visualize their information through a series of printed and digital “maps.”
Student work and course information can be found at: https://mappingdesignresearch.wordpress.com
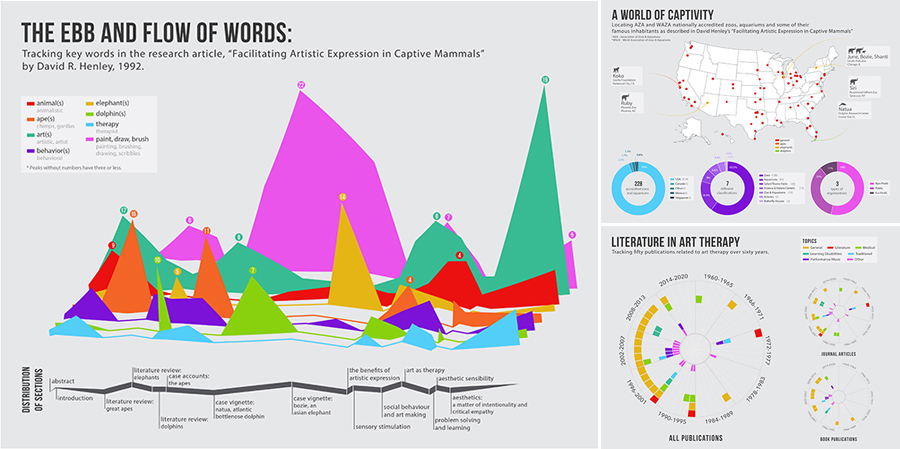
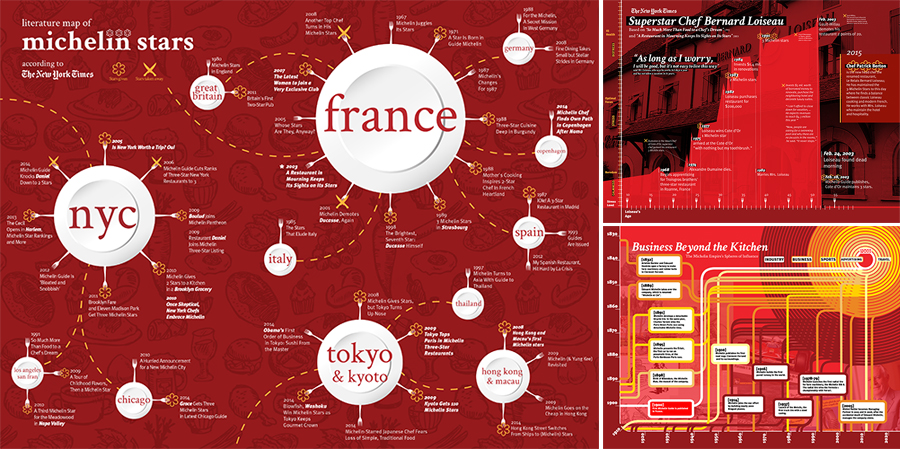
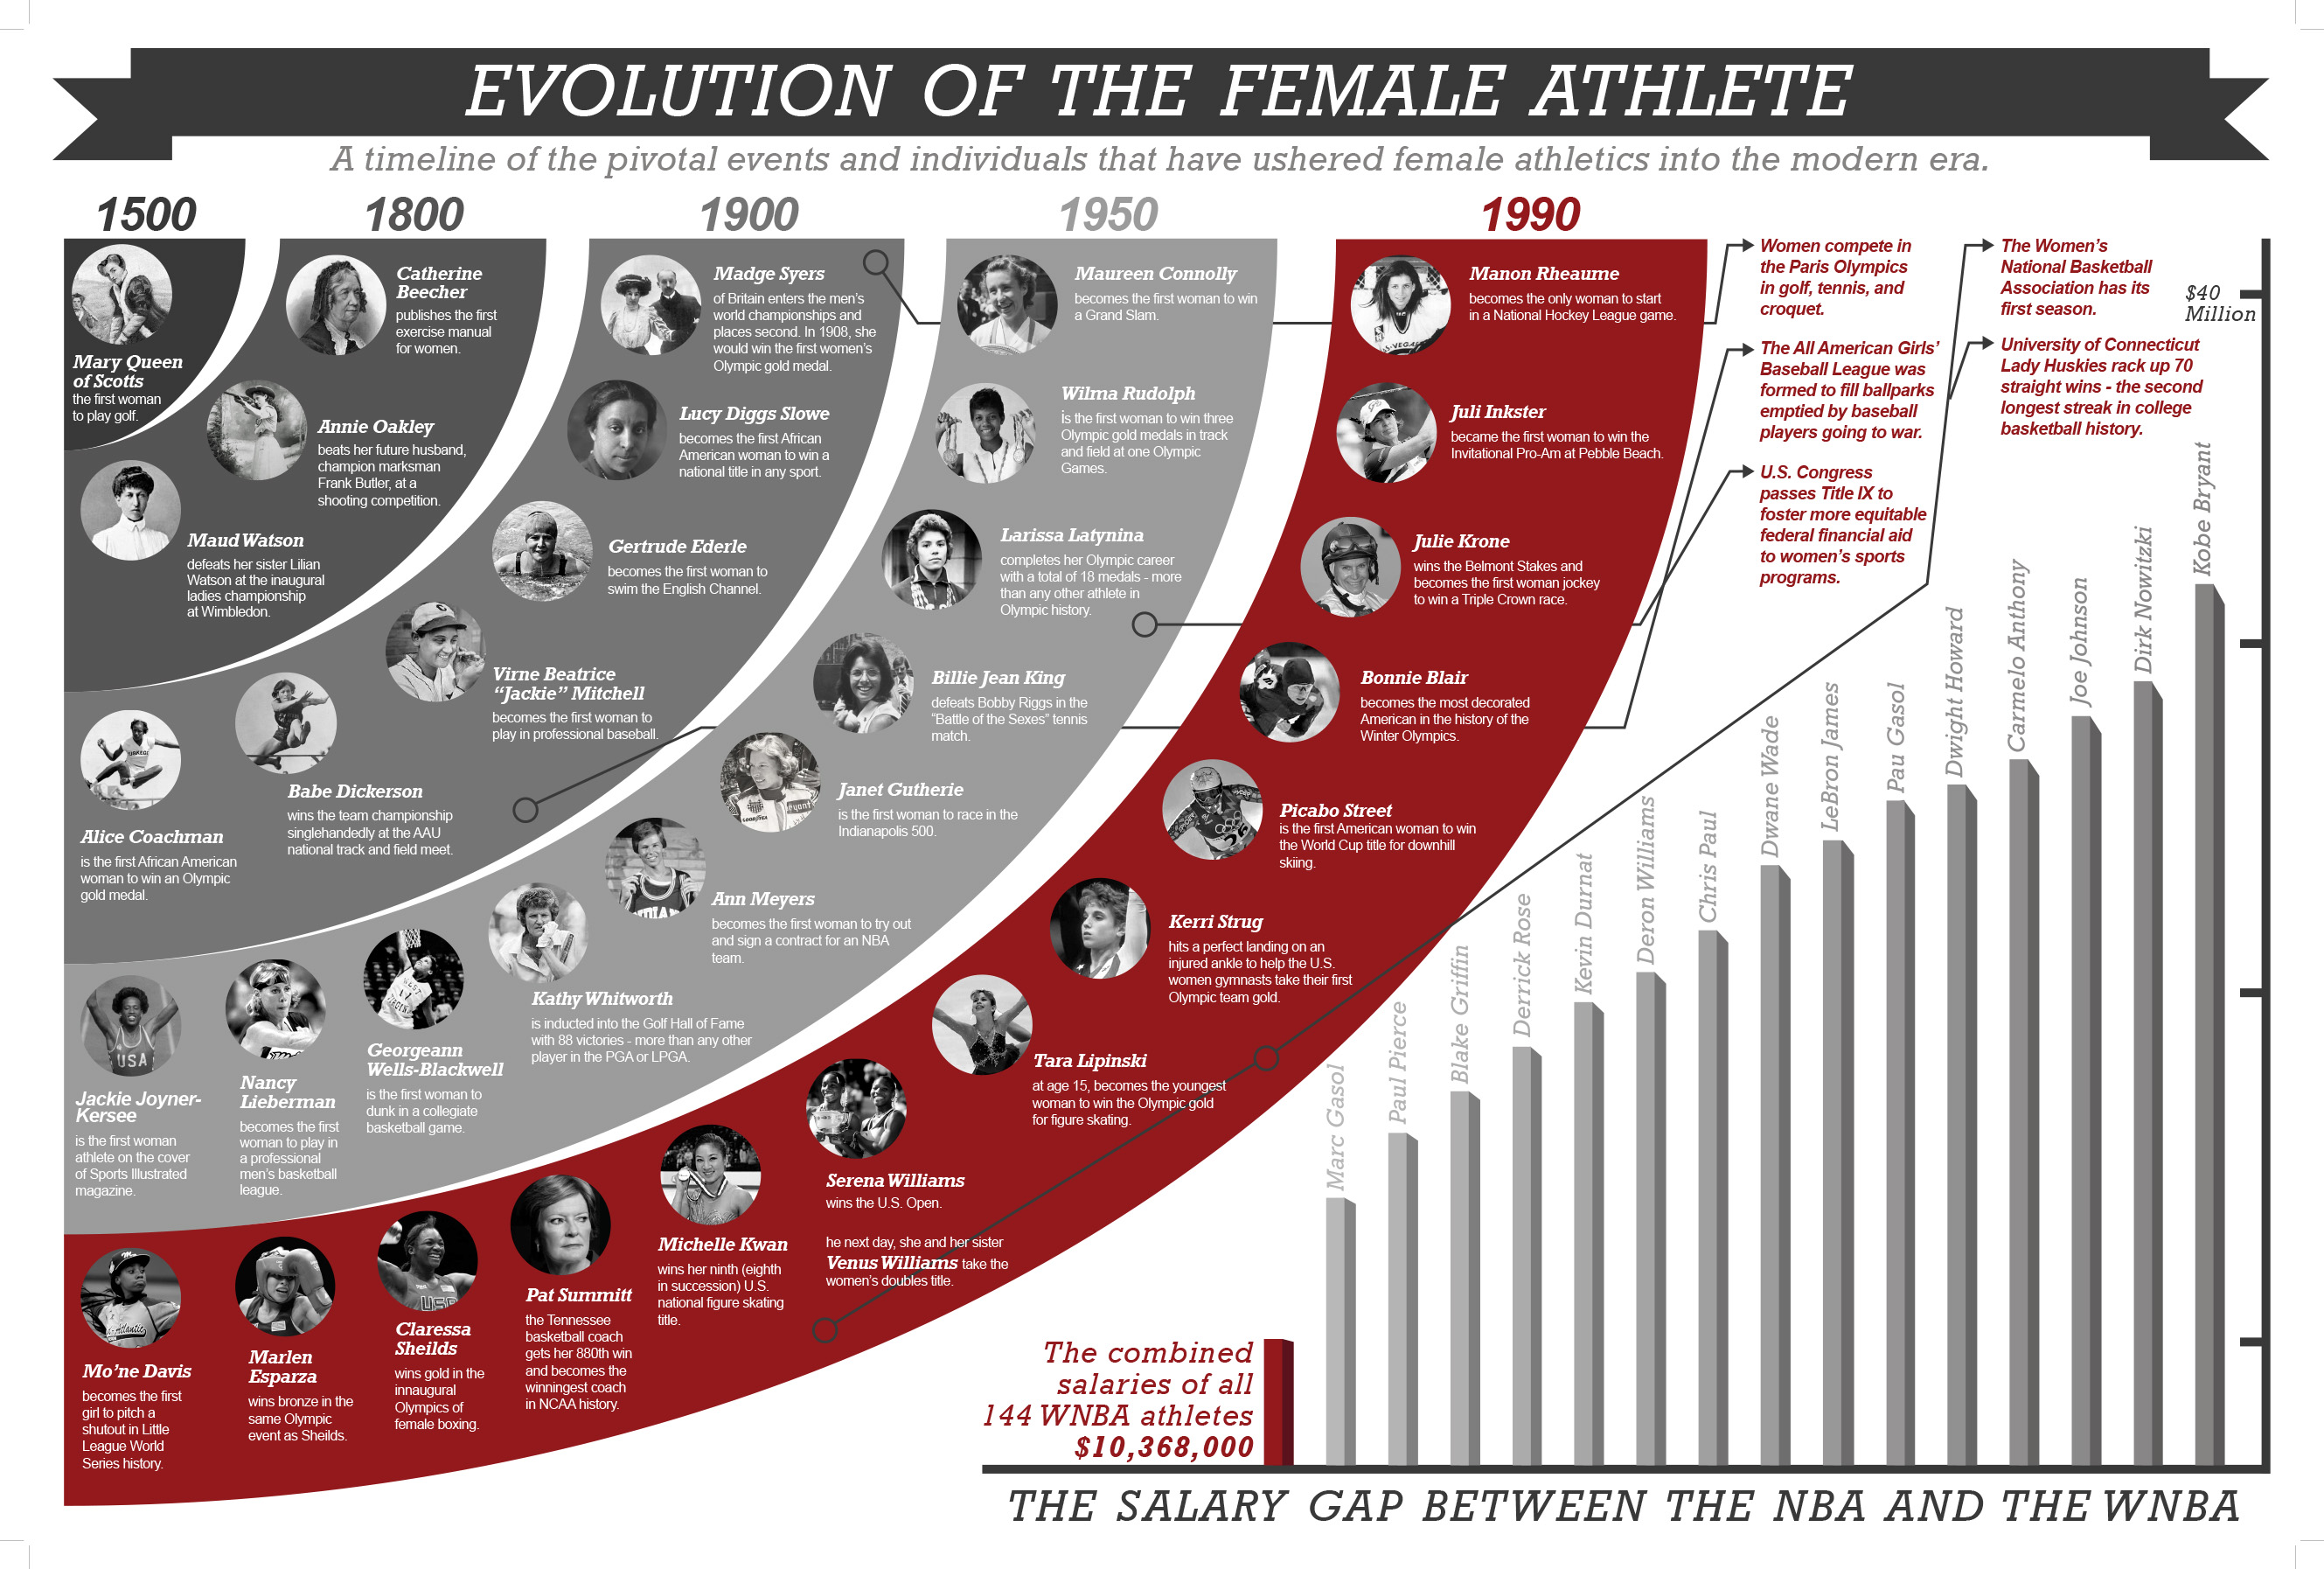
Sonia Hupefield-Cousineau: Temporal Maps: Mapping Literature, Article Content and Relational Data