 CONFINING CRIME: PUBLIC SAFETY BOUNDARIES AND OFFICER FORCES & PUBLIC SAFETY: CORRECTIONAL FACILITY HISTORY IN RALEIGH, NC
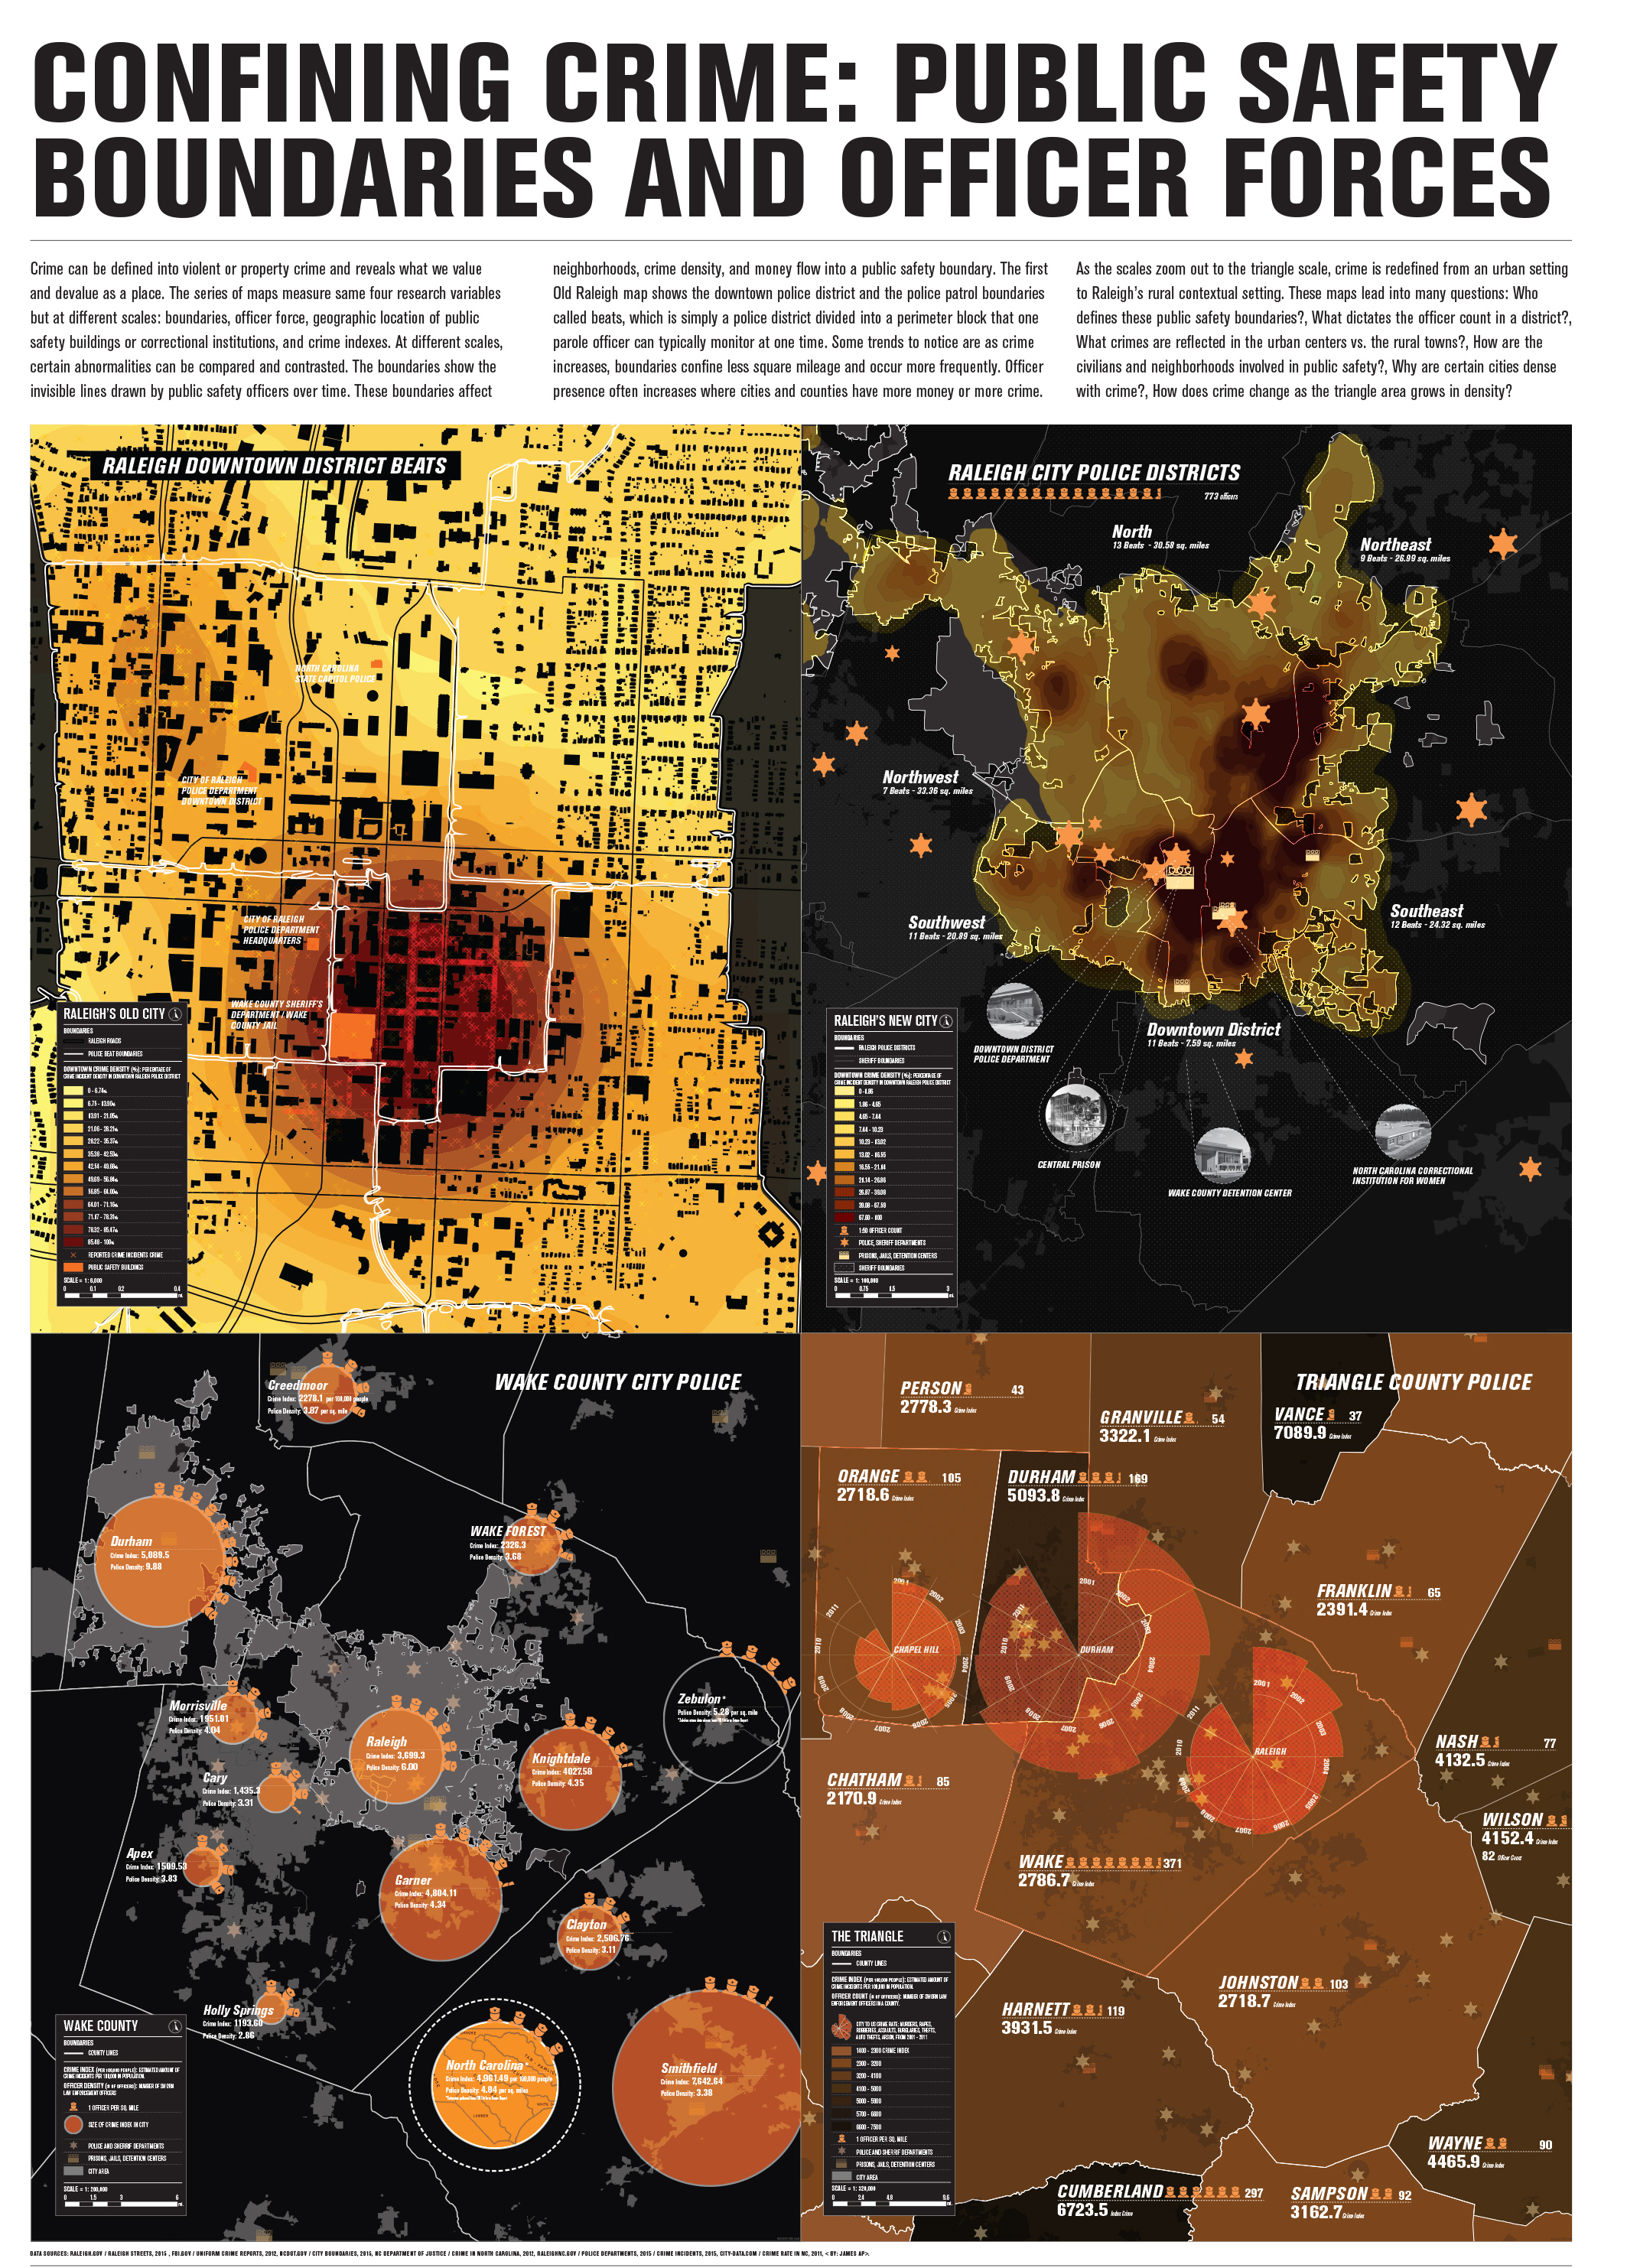
Crime can be defined into violent or property crime and reveals what we value and devalue as a place. The series of maps measure same four research variables but at different scales: boundaries, officer force, geographic location of public safety buildings or correctional institutions, and crime indexes. At different scales, certain abnormalities can be compared and contrasted. The boundaries show the invisible lines drawn by public safety officers over time. These boundaries affect neighborhoods, crime density, and money flow into a public safety boundary. The first Old Raleigh map shows the downtown police district and the police patrol boundaries called beats, which is simply a police district divided into a perimeter block that one parole officer can typically monitor at one time. Some trends to notice are as crime increases, boundaries confine less square mileage and occur more frequently. Officer presence often increases where cities and counties have more money or more crime.
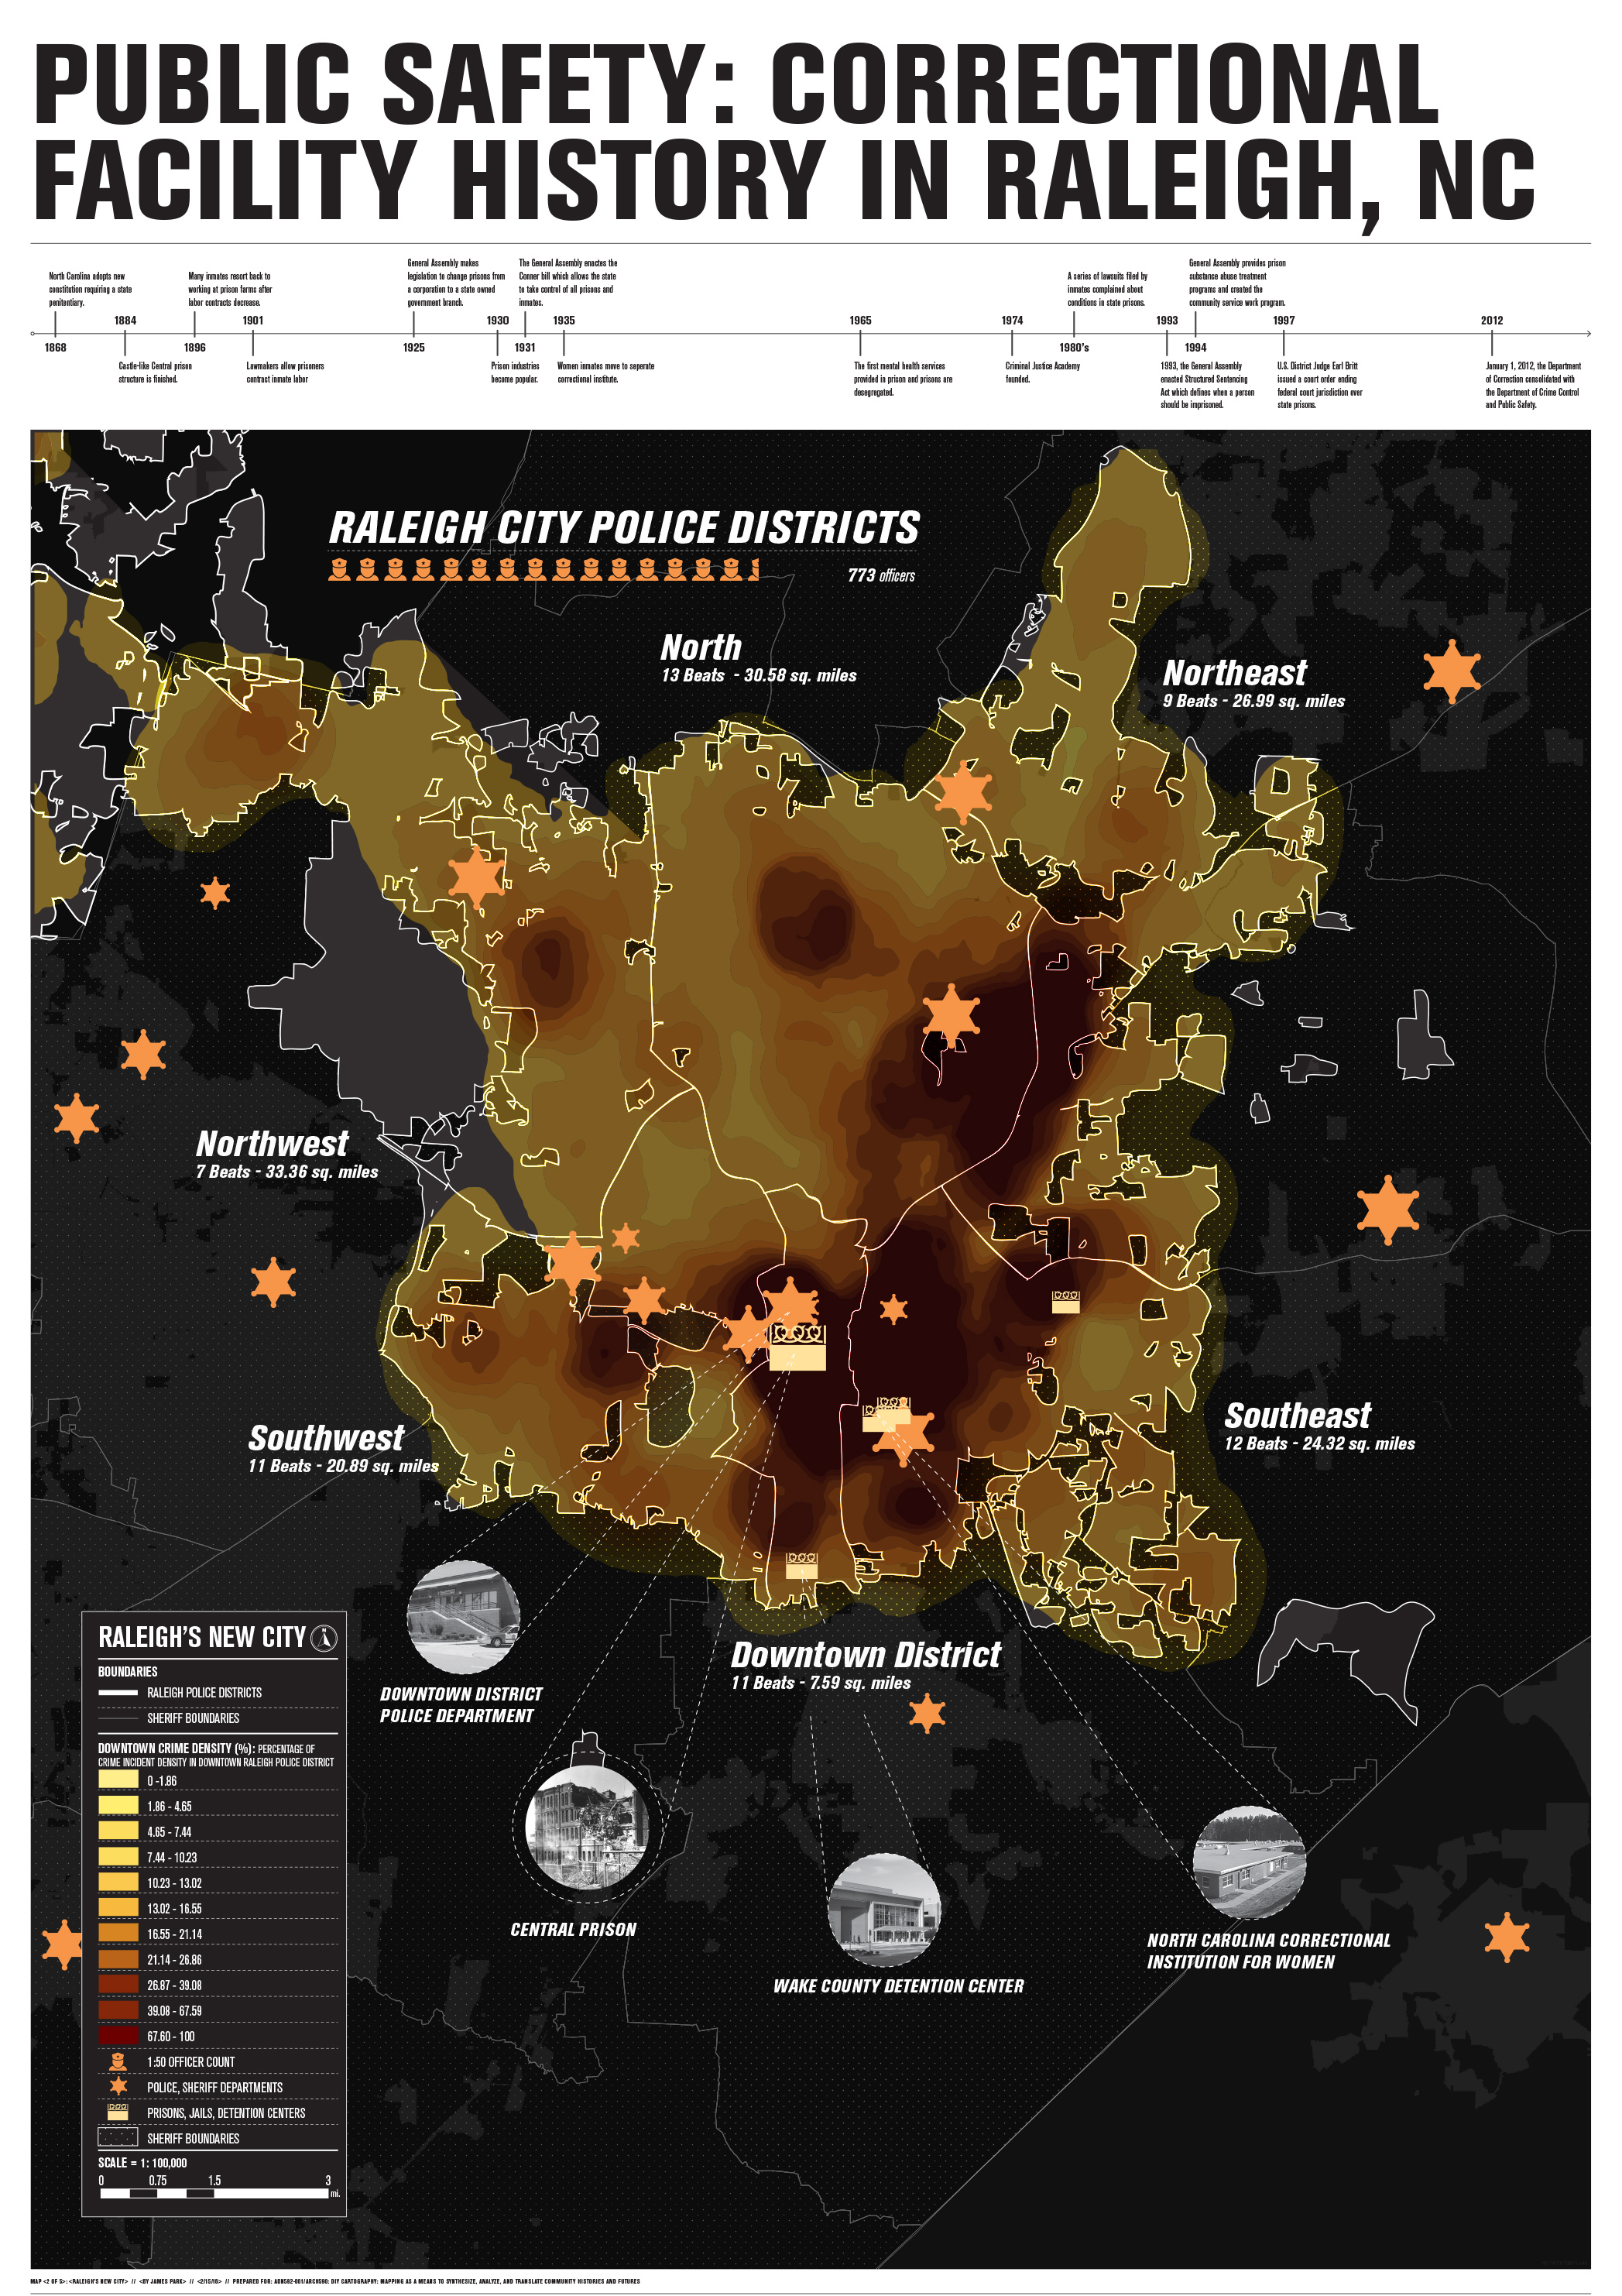
As the scales zoom out to the triangle scale, crime is redefined from an urban setting to Raleigh’s rural contextual setting. These maps lead into many questions: Who defines these public safety boundaries?, What dictates the officer count in a district?, What crimes are reflected in the urban centers vs. the rural towns?, How are the civilians and neighborhoods involved in public safety?, Why are certain cities dense with crime?, How does crime change as the triangle area grows in density?